
On this page
Graphify Claims 71.5× Fewer Tokens. We Tested It on Real Production Work.
Does Graphify actually reduce token usage in production? We compared Graphify and grep across real Claude Code sessions to measure cost, quality, and workflow.

Graphify claims up to 71.5× fewer tokens per query. We wanted to see whether those benchmark results translate to real production feature development with Claude Code.
Across three rounds and six implementation sessions, we didn't observe the dramatic session-level token savings suggested by the benchmark. Instead, our evaluation showed where Graphify helped, where it struggled, and how workflow design influenced the overall results.
Overview
We built the same real features two ways. One path could use graphify (query / path / explain). The other was limited to grep, find, and file reads. Same product surface (Claude Code). Then we compared cost, time, and code quality.
The story isn’t “graphify bad” or “graphify magic.” It’s that the efficiency pitch oversells what full sessions do, while a narrower pattern — weaker UI convention matching, occasional backend reuse wins — is what actually held across rounds.
What graphify is
Graphify builds a persistent graph of your codebase so AI agents can query project structure instead of rediscovering it with repeated searches.
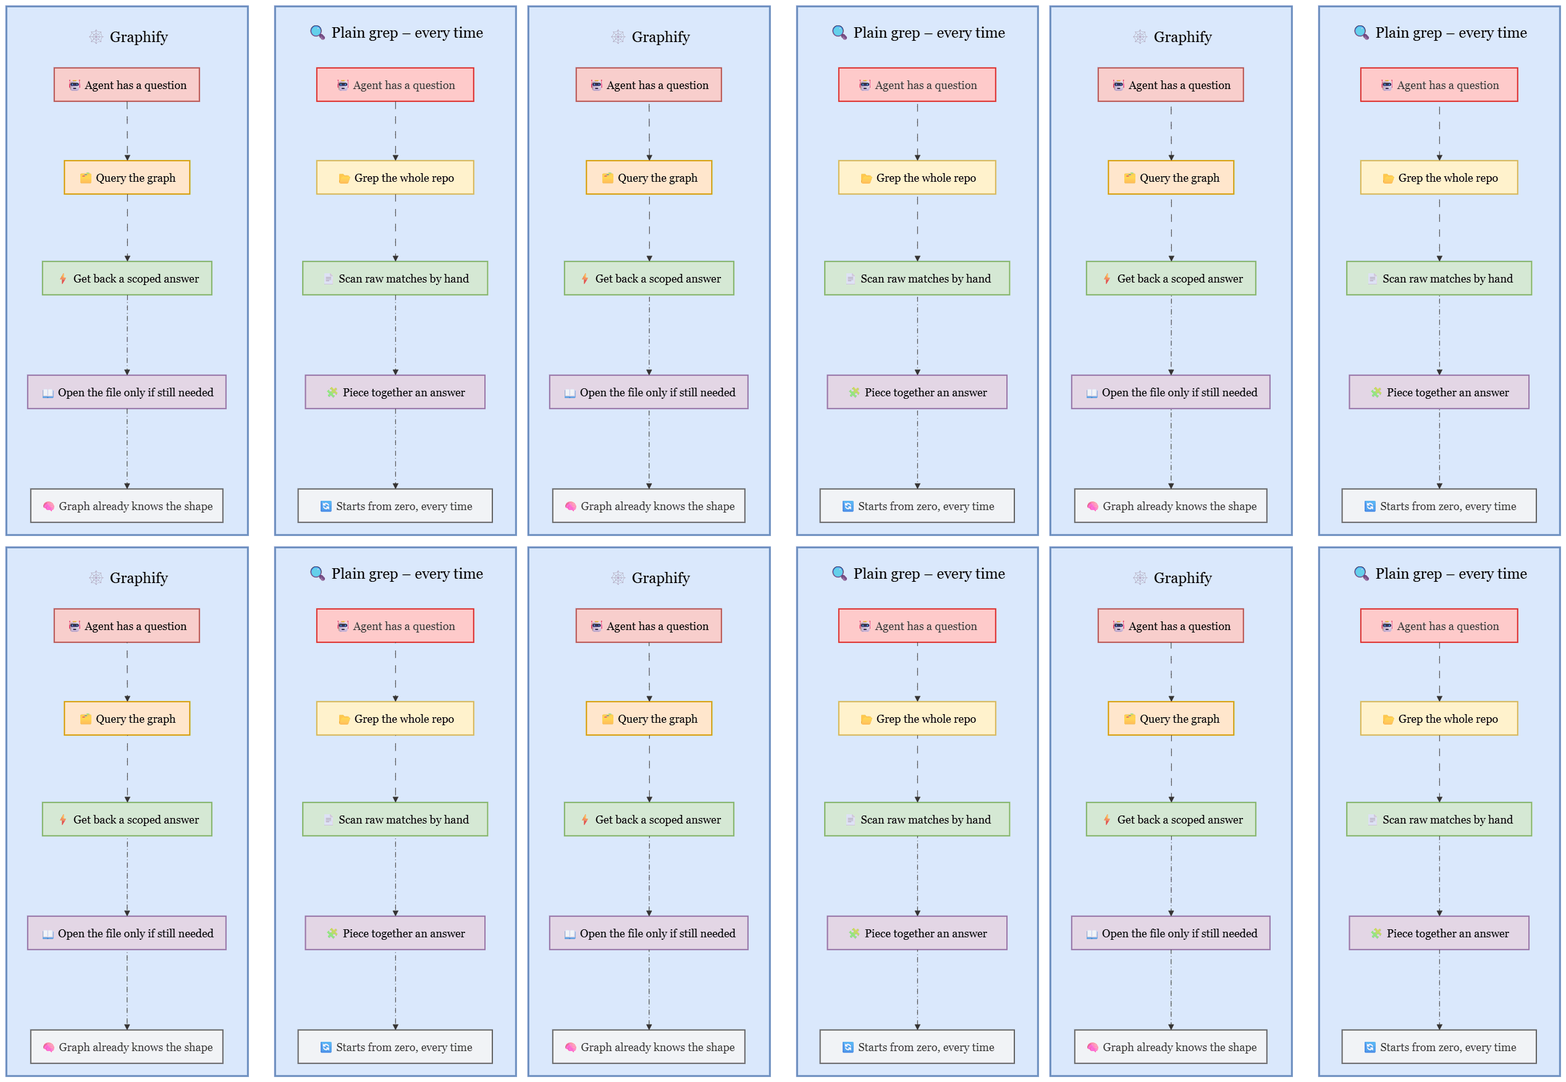
Once indexed, agents ask graphify query, explain, or path and get a scoped answer — then open files only where needed. Building the graph is a one-time cost per codebase; later tasks refresh it incrementally. The costs below are from feature-implementation sessions, not from a separate “index the repo” bill line.
How we tested
Three independent rounds over about a week. Each round: one graphify session and one no-graphify session. Small sample — directional evidence, not a powered study.
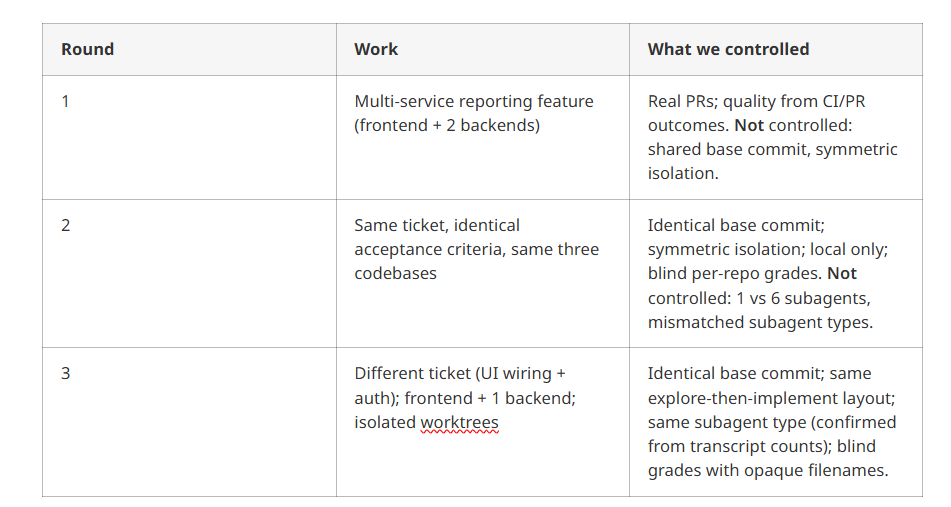
Fair, when we use the word, means: same ticket criteria, same starting commit, same isolation rules, same model surface, and (in round 3) the same parallel-work shape and subagent type.
Rounds 2–3 scored each repo’s diff blind on a fixed /25-per-repo scale via separate grading agents that did not know which method produced the diff (round 2 imperfect: method names could appear in paths; round 3 used opaque filenames). Round 1 used live CI/PR outcomes instead — so it is not on the same numeric scale. Evaluation by a KubeNine engineer; raw ticket IDs and repos are not published.
Tokens and cost
The consolidated evaluation did not support a large session-level token cut. Cost and time moved like this:
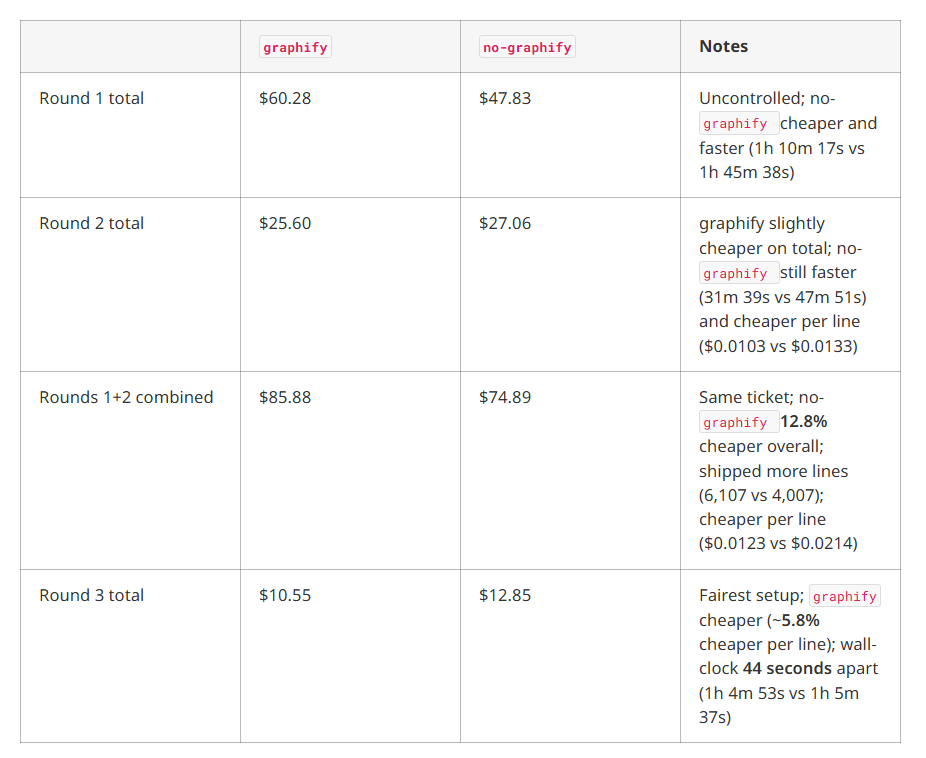
Round 3 flipped two patterns that held in rounds 1–2: graphify became cheaper per line, and wall time became equal. Both flips lined up with matching delegation shape and subagent type — the report’s reading is that those session mechanics, not graphify access alone, were driving a lot of the earlier gaps.
None of these results is a 50–60% (or 71.5×) session-level saving.
Quality: the gap shrank toward zero
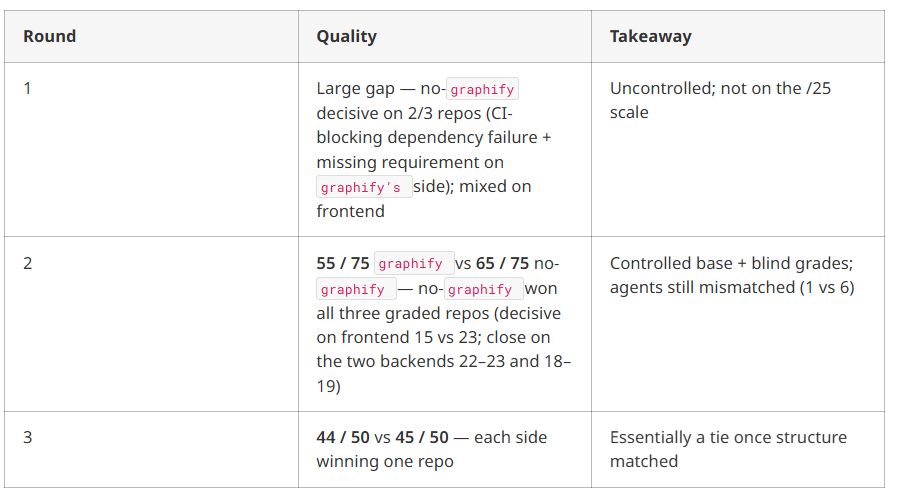
Every round that removed another confound showed a smaller quality gap. That is the headline of the consolidated evaluation — not “graphify always loses” or “graphify always wins.” Round 1 is directional only; it is not summed into the same score as rounds 2–3.
Where it helped
On backend work, results were narrow and mixed — not a broad win.
- Round 2: one backend was nearly tied (22 vs 23, no-graphify edged); the report notes graphify was the more architecturally faithful implementation there even so. The other backend was also a toss-up (18 vs 19).
- Round 3: graphify won the backend repo by 3 points, including an extra regression test on a hard correctness constraint.
The consolidated reading: roughly competitive-to-slightly-better backend regression discipline in 2 of 3 rounds — never a clean sweep.
Where it fell short
Frontend conventions — the most stable finding. The frontend app was graphify’s weakest codebase in all three rounds: zero tests in round 1; a decisive blind-score loss in round 2 (15 vs 23) with permissions/navigation defects; convention drift and tests that don’t run in this repo’s runner in round 3.
Agents still grep. Round 2: 46 grep calls vs 18 real graphify calls. Round 3: 18 graphify calls, still 29 grep/find alongside. Mandating the tool did not make it replace conventional search.
No wide quality win for graphify in any round. The quality gap never favored graphify by a wide margin. Narrow repo-specific edges only — never a clean sweep.
What the three rounds actually showed
The consolidated report’s headline: the apparent graphify-vs-no-graphify effect shrank every time a real confound got controlled, and nearly vanished once delegation shape and subagent type were matched in round 3.
Several early gaps traced to session mechanics, not the tool: asymmetric isolation and unverified base commits in round 1; one big agent vs six narrow agents and mismatched subagent types in round 2; imperfect blinding until round 3 fixed filenames. An unexplained model charge in round 2 (~$2.62) was later traced to a built-in advisor path that fires for a particular subagent type — not to graphify.
What’s left after that narrowing is small and specific: weaker UI-convention fidelity on the frontend across every attempt, and roughly competitive-to-slightly-better backend regression discipline in 2 of 3 rounds. That is the claim the consolidated three-round report actually supports.
Limitations
- Six sessions total (n=1 per condition per round)
- Feature implementation only — not greenfield, pure refactors, or debug-only work
- Claude Code only
- A multi-service production stack (frontend + backends), anonymized here
- Round 1 quality is CI/PR-based, not on the same /25 scale as rounds 2–3
A useful next step would keep the round-3 controls fixed and run more replicates — to see whether the residual frontend/backend pattern is signal or noise.
Key findings
- The big token-savings claim is a per-query microbenchmark, not what you pay for a full agent feature session.
- Across three rounds (six sessions total), every time we controlled another session confound, the quality gap between graphify and plain grep shrank. In the rounds, blind scores were 44 / 50 (graphify) vs 45 / 50 (no-graphify) — essentially a tie, each side winning one repo.
- Cost was not a flat win either way. Round 1 and rounds 1+2 combined favored no-graphify on total spend ($60.28 vs $47.83; $85.88 vs $74.89). Round 2 total slightly favored graphify ($25.60 vs $27.06). Round 3 favored graphify ($10.55 vs $12.85). Cost-per-line still favored no-graphify in rounds 1–2 and graphify only narrowly in round 3. Nowhere near a 50–60% session cut.
- Frontend was graphify’s weakest area in all three rounds. Backend was competitive in places — never a wide overall win for graphify.
- Agents under-used graphify even when told to prefer it — they kept grepping alongside it.
- The cleanest signal in the whole series: wall-clock time. Tens of minutes apart in rounds 1–2; 44 seconds apart in round 3 once both sides used the same explore-then-implement shape. Structure, not the tool, was doing a lot of the work.
Frequently Asked Questions (FAQ)
What is Graphify?
Graphify is a code intelligence tool that lets AI coding agents query a codebase's structure instead of repeatedly searching files.
Does Graphify reduce token usage?
Graphify reduced tokens per query in its benchmark, but our production sessions didn't show the same level of session-wide token savings.
Does Graphify replace grep?
No. During our evaluation, AI agents continued using grep alongside Graphify for code navigation and implementation.
Is Graphify better for backend development?
In our tests, Graphify performed better on backend tasks than frontend work, especially when reusing existing service patterns.
Should you use Graphify with Claude Code?
Graphify can help explore large codebases, but teams should measure its impact using their own production workflows.
What was the biggest finding?
Workflow design influenced cost, quality, and completion time more than Graphify alone.
Final Thoughts
Graphify isn’t an upgrade over grepping around, and it isn’t empty either. The advertised token collapse did not show up as a session-level 50–60% saving in our work. What held up was narrower: occasional help finding backend patterns worth reusing, a consistent soft spot on frontend convention fidelity, and a hard lesson that how you structure the agent session can dwarf whether graphify is on or off.
If you’re deciding whether to use it:
- Use it when the question is “does this service pattern already exist, and where?”
- Don’t expect it to replace reading sibling UI files when style and wiring matter
- Don’t budget for a fixed token or cost saving — measure your own sessions
- Treat “always query the graph first” as a nudge; agents will still grep, and that’s normal
- If you’re A/B testing tools like this, match base commits, isolation, and agent shape first — or you’ll measure your workflow, not the tool
Read More
- Beyond Git Worktrees: What It Actually Takes to Run Parallel AI Agents
https://www.kubeblogs.com/run-parallel-ai-agents-git-worktrees-local-setup/ - Terraform with AI: Build AWS Infra (Cursor + MCP)
https://www.kubeblogs.com/terraform-with-ai-cursor-mcp/ - Supercharging AI IDEs with Model Context Protocol (MCP)
https://www.kubeblogs.com/supercharging-ai-ides-with-model-context-protocol/