
On this page
Kubernetes Traffic Skew: Why One Pod Gets Hot While Others Sit Idle

Introduction
Your Kubernetes autoscaler might be solving a problem that doesn't exist, while ignoring the one that does.
One pod pinned at 90% CPU, four identical replicas idling under 5%. It's assumed to be a capacity problem, and HPA scales out. But it doesn't help. The deployment grows from 5 pods to 15, new EC2 nodes get provisioned to fit them, and none of those new pods ever receive a single request. You end up paying for three times the compute while the exact same pod is still throttling underneath it all.
We reproduced this on a live EKS cluster, measured the skew, and tested fixes at three levels: application, cluster, and platform. Here's the full breakdown.
The Core Issue
The reason scaling out doesn't help comes down to how kube-proxy decides where traffic goes. It picks a backend pod once, at the TCP handshake, not once per HTTP request. Every subsequent request on that connection just rides the same pipe, invisible to kube-proxy. And since modern HTTP clients keep a small pool of persistent connections open by default instead of reconnecting per request, that first random pick effectively becomes permanent for the life of the connection.
This is why restarting the hot pod never actually fixes it. It doesn't change the routing logic, it just resets which pod wins the next coin flip. And it's why adding more replicas doesn't help either: new pods only get traffic if a new connection is established, and existing clients aren't opening new connections.
Why One Pod Takes All the Traffic
North-South vs. East-West: Two Different Routing Models
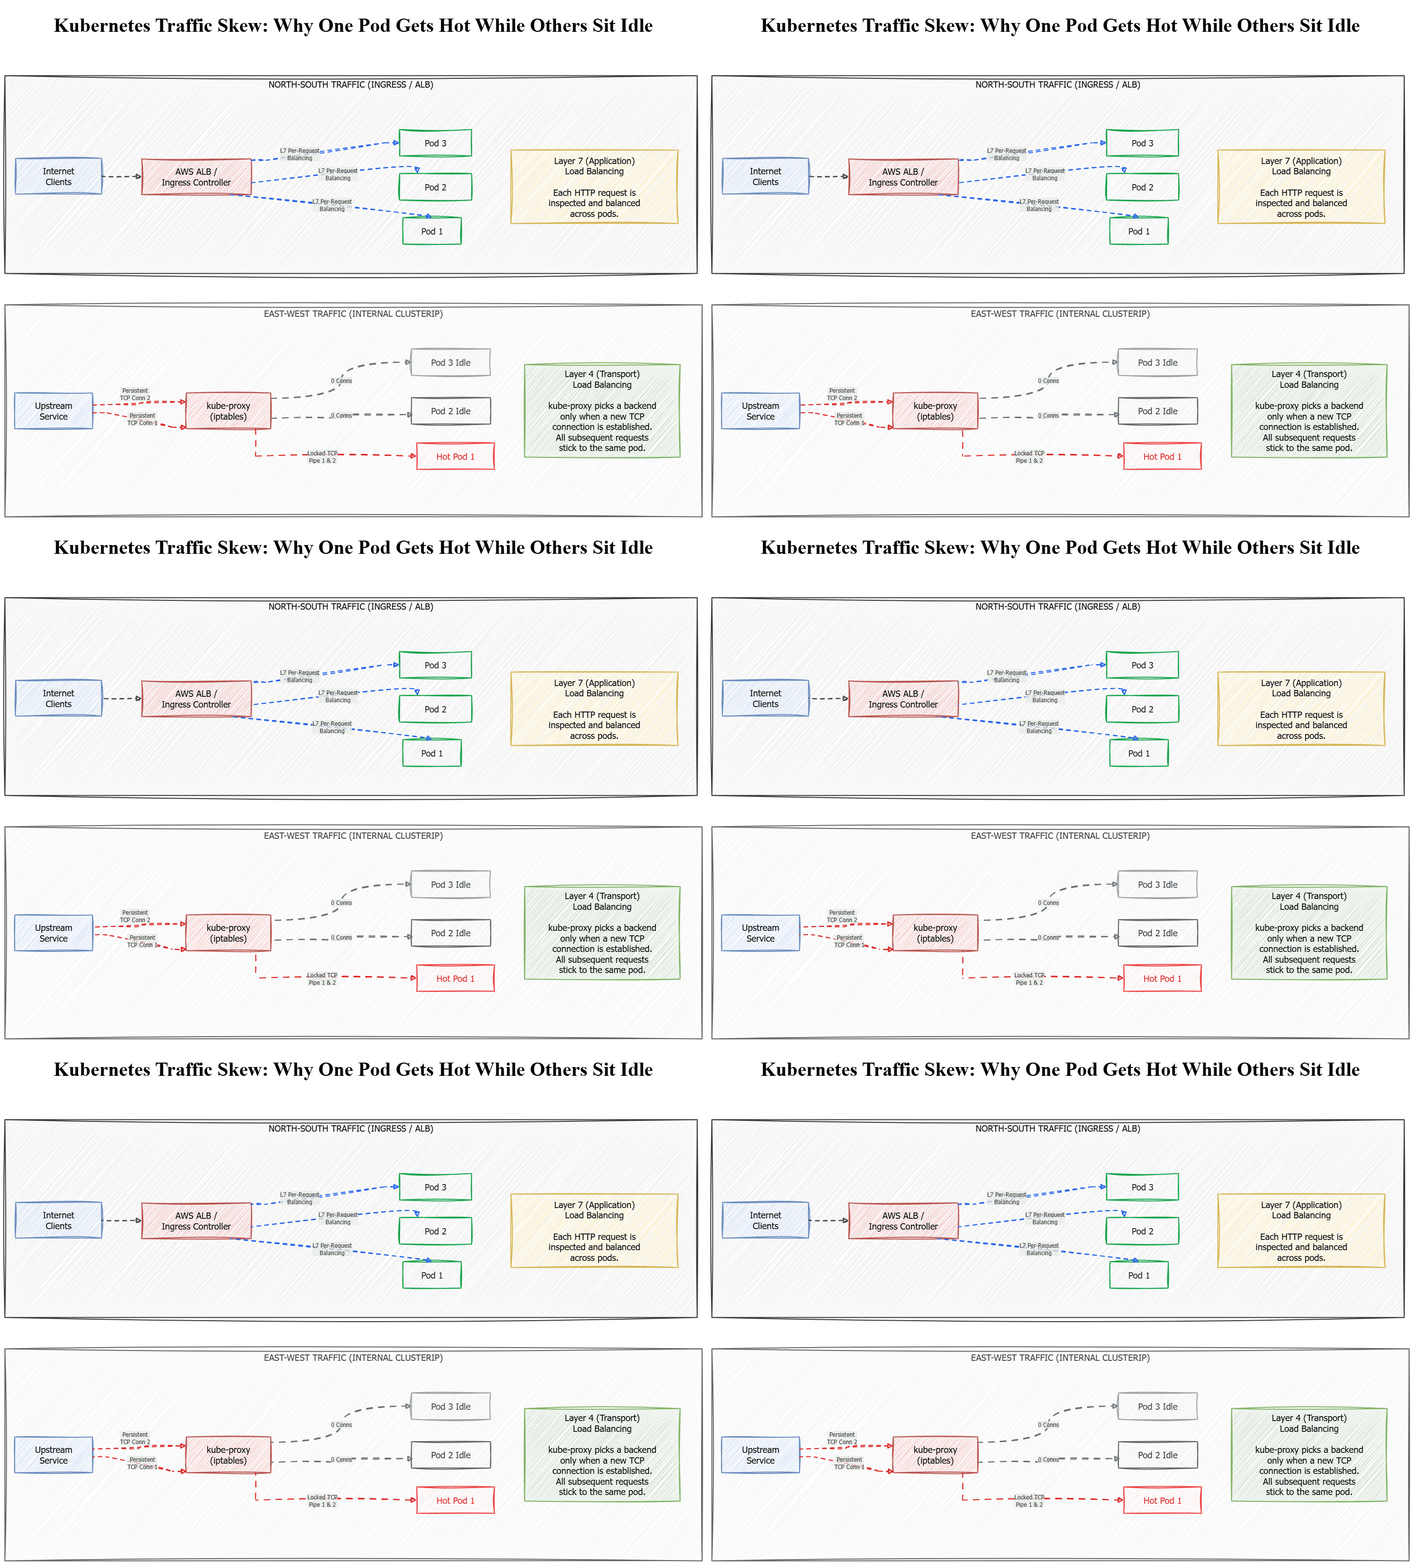
External traffic hitting your cluster through an ALB or Ingress controller gets balanced at Layer 7 — each HTTP request is independently routed to a backend pod. This works well.
Internal pod-to-pod traffic through a ClusterIP service is a different story. It's handled entirely by kube-proxy at Layer 4.
How kube-proxy Actually Routes
By default on EKS, GKE, and most Kubernetes distributions, kube-proxy programs iptables rules with random statistical probability:
-A KUBE-SVC-XXX -m statistic --mode random --probability 0.3333333333 -j KUBE-SEP-AAA
-A KUBE-SVC-XXX -m statistic --mode random --probability 0.5000000000 -j KUBE-SEP-BBB
-A KUBE-SVC-XXX -j KUBE-SEP-CCC
These rules only fire when a new TCP connection is established — on the SYN packet. Once the connection exists, every subsequent HTTP request flows through the same pipe. iptables never sees individual requests, URLs, or headers.
The Keep-Alive Trap
Modern microservice clients — Go's http.Client, Node.js undici/axios, Python httpx, Java Spring WebClient, gRPC — all use persistent connection pools by default. Instead of opening a new TCP connection per request, they open a small pool at startup and reuse it indefinitely.
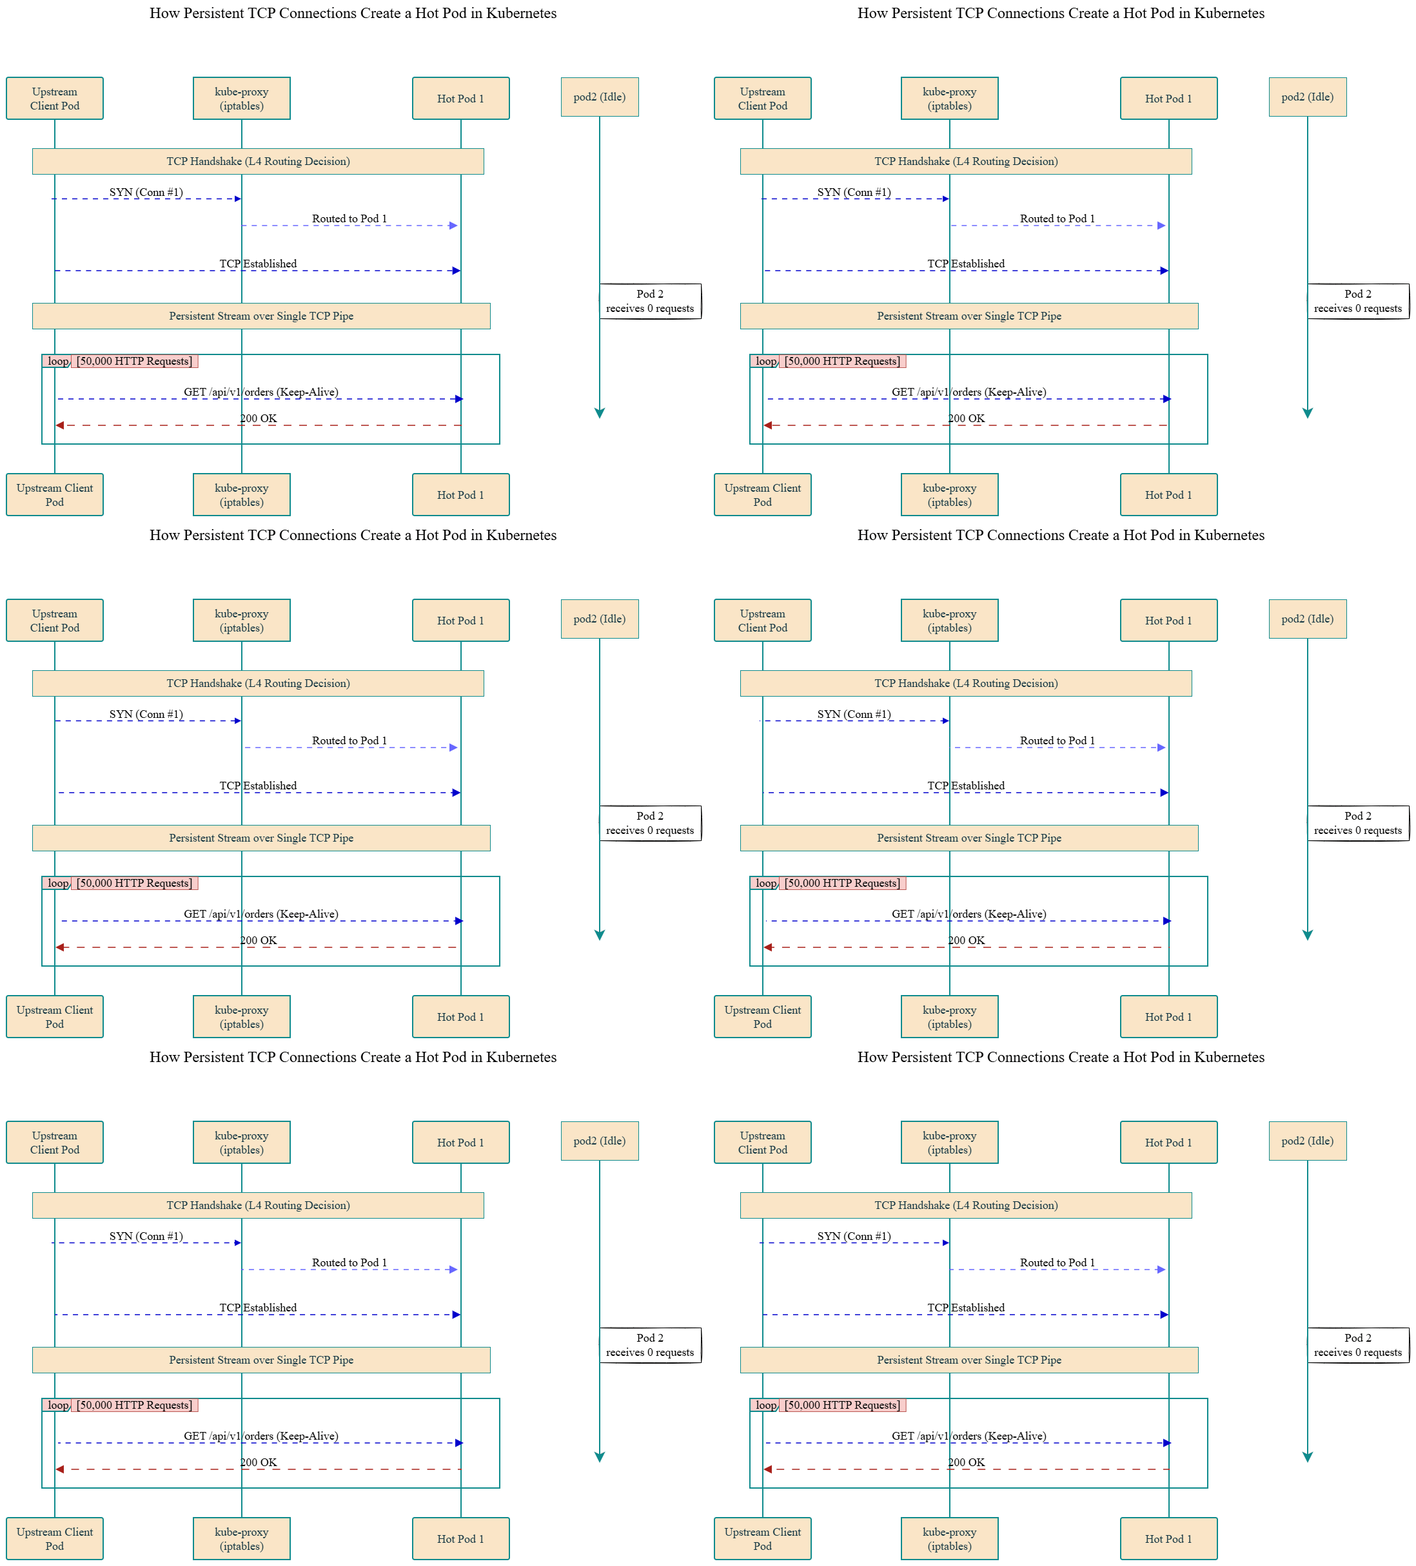
The client opens 2-4 persistent connections. Due to randomness at startup, they land on Pod 1 and maybe Pod 2. Over the next several hours, millions of requests flow through those pipes. Pod 1 handles everything. Pods 3, 4, and 5 sit completely idle.
The Cost Impact: How Skew Triggers Runaway Autoscaling
Connection skew doesn't just cause latency jitter , it triggers a chain reaction in your autoscaling infrastructure.
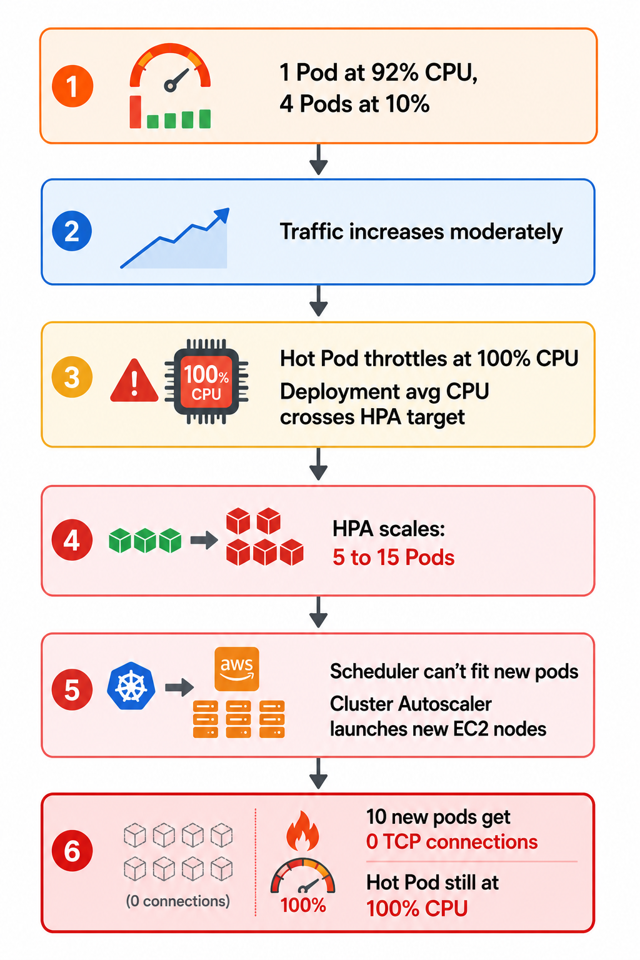
This is how it escalates:
- HPA trigger. The Horizontal Pod Autoscaler monitors average CPU across replicas. With one pod at 92% and four at 10%, the average is about 26%. As traffic grows, the hot pod saturates at 100%, other pods climb slightly, and the average crosses the 50% HPA target.
- Scale-out. HPA scales the deployment from 5 to 15 pods.
- Compute provisioning. New pods don't fit on existing nodes. Cluster Autoscaler or Karpenter provisions additional worker nodes.
- Dead-weight capacity. Because upstream clients maintain their existing TCP connections, zero requests reach the 10 newly created pods.
You're now paying for a 15-pod deployment and multiple EC2 nodes, yet a single pod is still doing all the work and throttling your p99 latency.
What We Measured on a Live Cluster
We reproduced this on an EKS cluster running a 5-replica backend deployment with CPU-bound hashing, monitored with Prometheus and Grafana.
Scenario 1: Default persistent connections (the skew)
When the upstream client opens persistent TCP connections without recycling, traffic locks onto whichever pod won the initial TCP handshake:
Live Monitoring Data (Scenario 1 — Persistent Connection Skew)
Grafana CPU Quota table showing backend worker pod taking 114% of its CPU request, while other replicas idle down to 35% or lower.
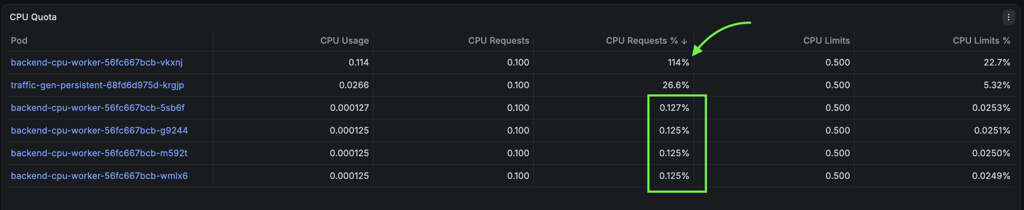
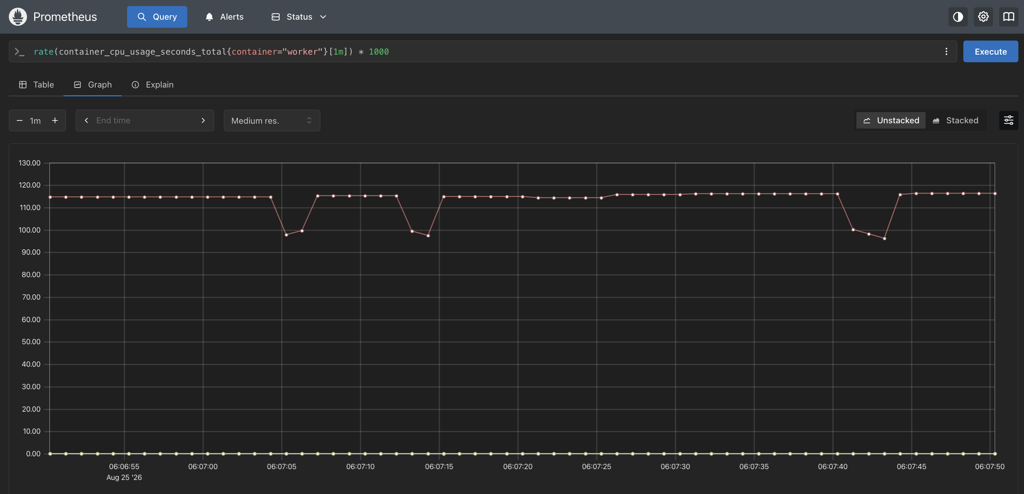
Real-time Prometheus data across the 5 identical replicas:
Pod Name                            | Real-Time CPU Usage  | Traffic Status
------------------------------------+----------------------+--------------------
backend-cpu-worker-56fc667bcb-vkxnj | 112.66 millicores    | HOT POD (112.6m)
backend-cpu-worker-56fc667bcb-m592t |   0.10 millicores    | IDLE (0.10m)
backend-cpu-worker-56fc667bcb-g9244 |   0.10 millicores    | IDLE (0.10m)
backend-cpu-worker-56fc667bcb-wmlx6 |   0.09 millicores    | IDLE (0.09m)
backend-cpu-worker-56fc667bcb-5sb6f |   0.06 millicores    | IDLE (0.06m)
A single pod handled over 1,000x the CPU load of its peers. Four pods consumed cloud spend without processing a single request.
Scenario 2: Connection recycling active (balanced fleet)
When we applied client-side connection recycling — reconnecting after a request threshold with jitter — kube-proxy re-evaluated routing on each new handshake, distributing traffic evenly:
Live Monitoring Data (Scenario 2 — Balanced Fleet via Connection Recycling)
Grafana and Prometheus showing even CPU distribution across all 5 replicas with zero hot pods.

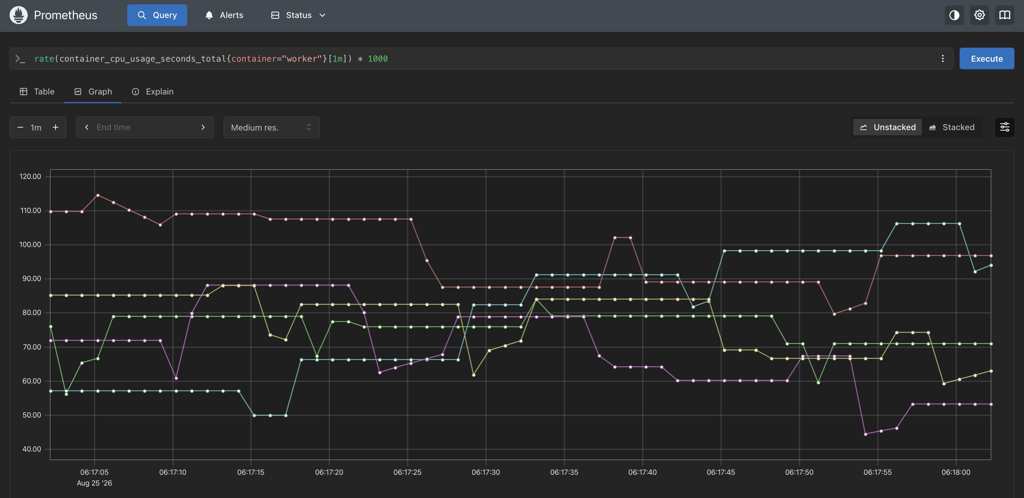
Pod Name                            | Requests Handled | Traffic %
------------------------------------+------------------+----------
backend-cpu-worker-56fc667bcb-5sb6f | 2,042            |   63.6%
backend-cpu-worker-56fc667bcb-m592t | 2,015            |   78.2%
backend-cpu-worker-56fc667bcb-vkxnj | 1,992            |   86.5%
backend-cpu-worker-56fc667bcb-wmlx6 | 1,981            |   87.5%
backend-cpu-worker-56fc667bcb-g9244 | 1,970            |   85.1%
How to Fix It: A 3-Tier Strategy
The right fix depends on your architecture and operational constraints.
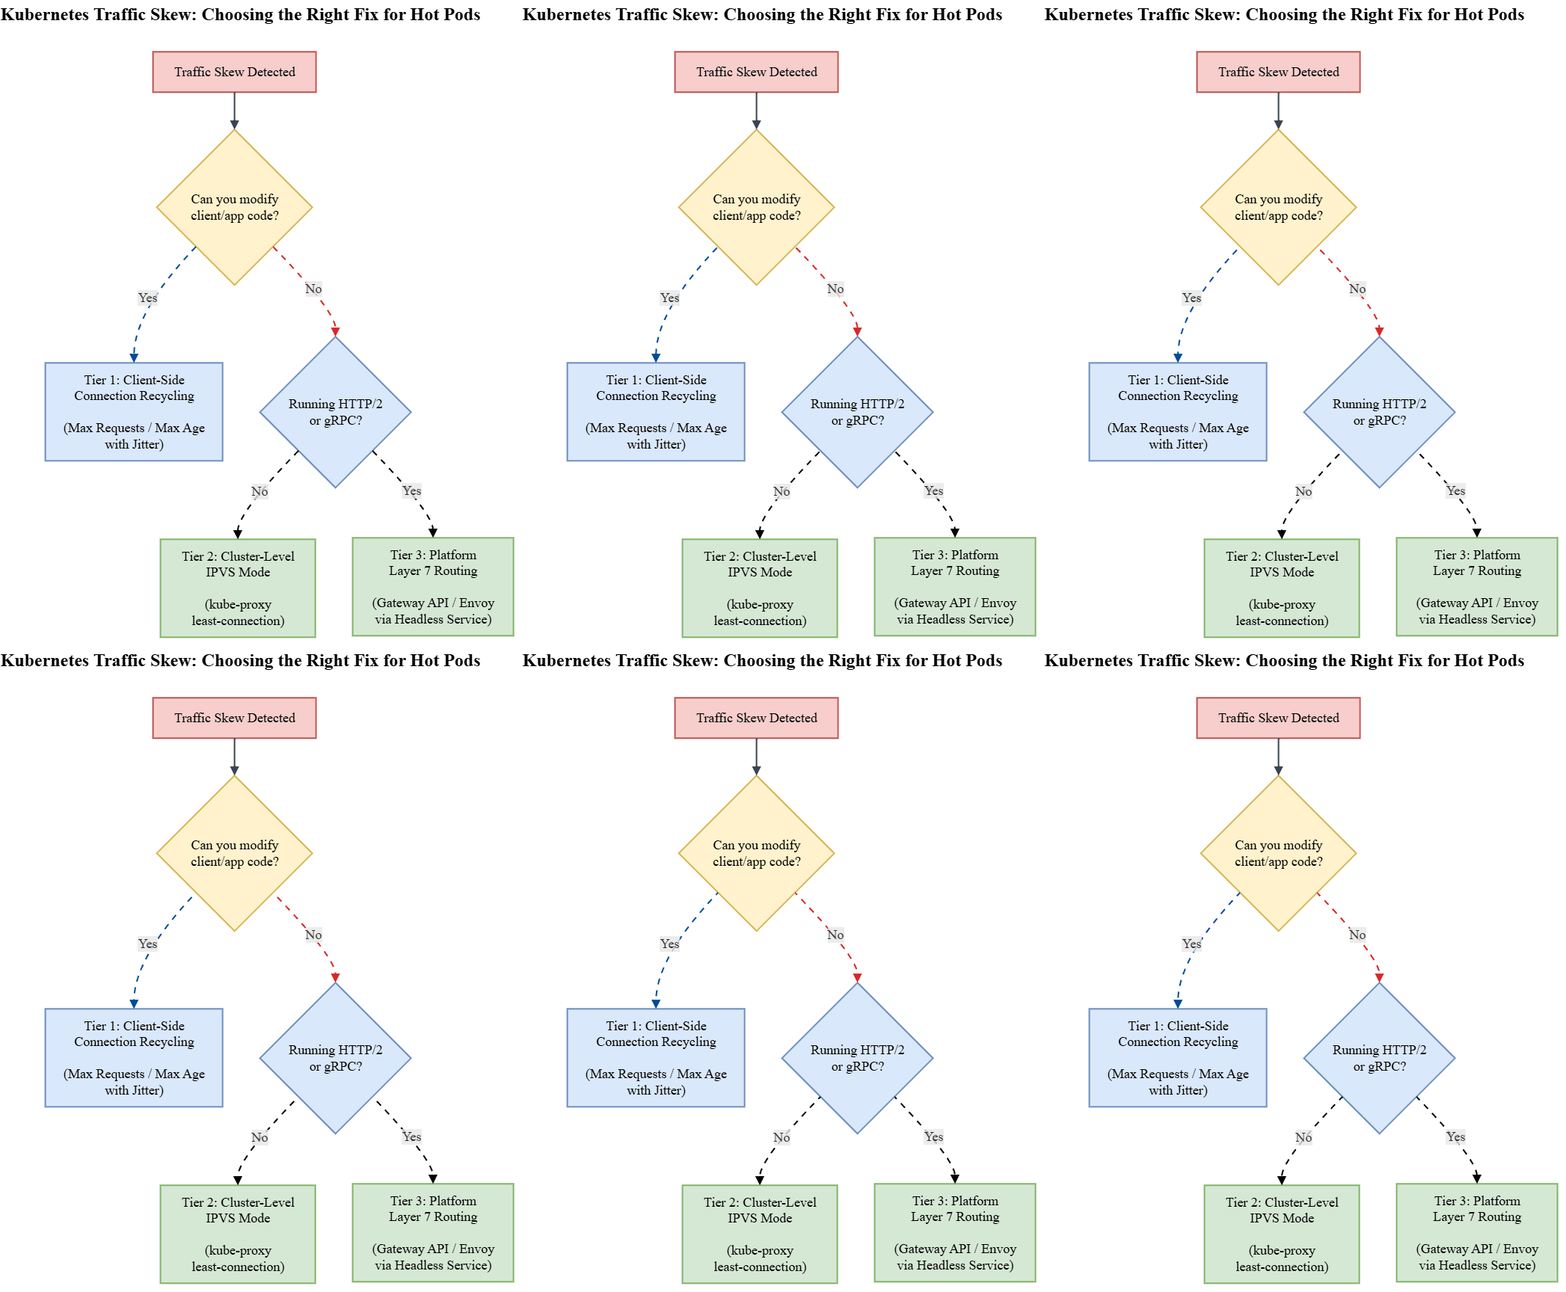
Tier 1: Connection Recycling (Application-Level)
The quickest stopgap if your team owns the calling service. Force client connection pools to periodically close and re-establish TCP connections — each new handshake gives kube-proxy a chance to rebalance. Add randomized jitter to avoid thundering herd reconnections.
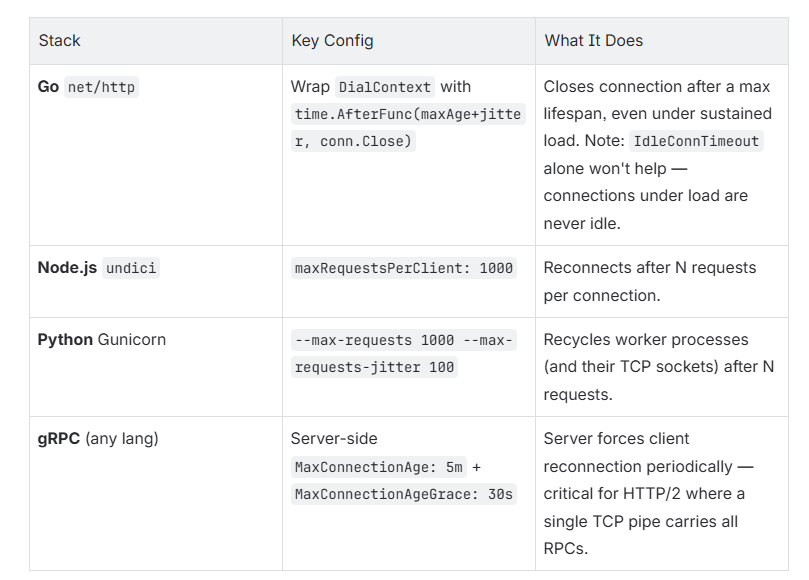
This works, but it requires every calling service to opt in. If you run dozens of polyglot services, that's a lot of client changes to coordinate. Tiers 2 and 3 solve this at the platform layer instead.
Tier 2: IPVS Mode (Cluster-Level)
If you have dozens of polyglot services where changing client libraries across the board isn't practical, switch kube-proxy from iptables to IPVS mode with the lc (Least-Connection) scheduler.
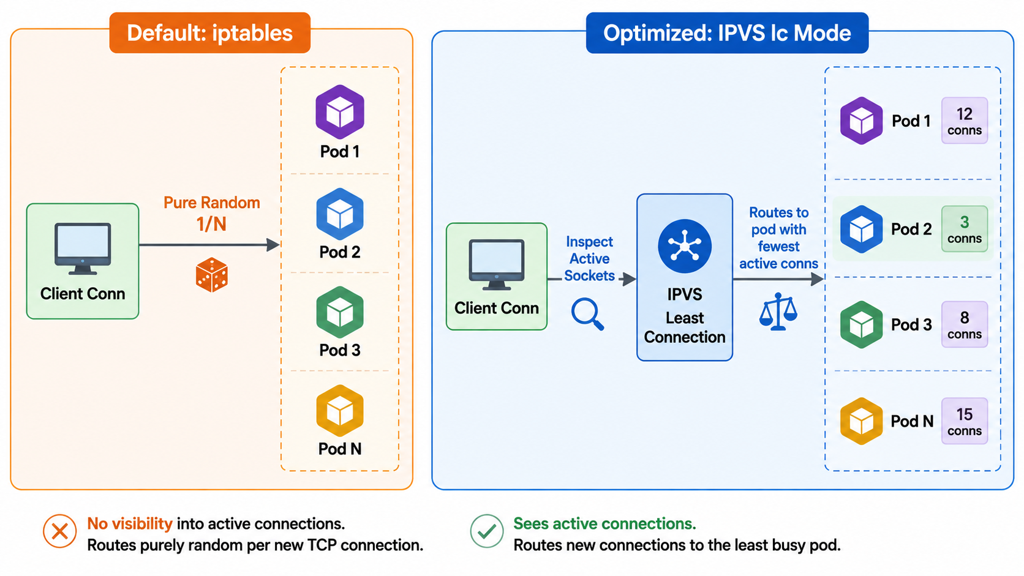
apiVersion: kubeproxy.config.k8s.io/v1alpha1
kind: KubeProxyConfiguration
mode: "ipvs"
ipvs:
  scheduler: "lc"
Tier 3: Layer 7 Gateway (Platform-Level)
For HTTP/2 and gRPC fleets, Layer 4 balancing is fundamentally insufficient. The solution is Layer 7 per-request routing through the Kubernetes Gateway API or an internal Envoy proxy.
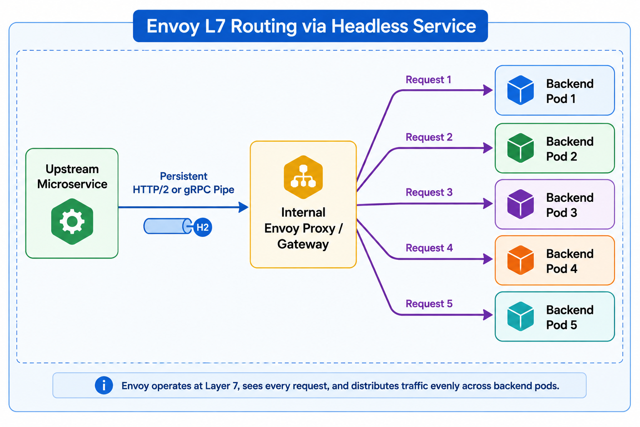
Important: When configuring Envoy with STRICT_DNS, point it at a Headless Service (clusterIP: None), not a standard ClusterIP. A standard ClusterIP returns one VIP in DNS, so Envoy would send all requests through kube-proxy — recreating the hot pod problem. A Headless Service returns all individual pod IPs, allowing Envoy's round-robin engine to balance per-request directly across endpoints.
apiVersion: v1
kind: Service
metadata:
  name: backend-cpu-worker-headless
spec:
  clusterIP: None
  selector:
    app: backend-cpu-worker
  ports:
  - port: 80
    targetPort: 8080
With this setup, Envoy inspects every HTTP request or gRPC frame and balances on a per-request basis. Pod CPU distribution stays within 2-5% variance across all replicas.
FAQs
What is Kubernetes traffic skew?
Kubernetes traffic skew happens when one pod receives much more traffic than other replicas, creating a hot pod while others remain idle.
Why does one Kubernetes pod get all the traffic?
Persistent TCP connections can keep requests connected to the same backend pod after kube-proxy makes the initial routing decision.
Does HPA fix Kubernetes traffic skew?
Not always. HPA can add more pods while existing persistent connections continue sending traffic to the hot pod.
How do you fix Kubernetes traffic skew?
Common approaches include connection recycling, cluster-level load balancing, and Layer 7 routing.
Why are Kubernetes pods idle while one pod is overloaded?
Because multiple requests can share persistent TCP connections, keeping traffic pinned to the pod selected when the connection was established.
Conclusion
The "Hot Pod" illusion is one of the most common and expensive silent failures on Kubernetes platforms. Layer 4 iptables routing combined with default HTTP Keep-Alive connection pooling locks traffic onto random pods, pushes average CPU past HPA thresholds, and spawns clusters of idle compute nodes you're paying for.
The fix is straightforward: recycle connections in your clients (Tier 1), switch to IPVS least-connection mode (Tier 2), or adopt Layer 7 Gateway routing for internal services (Tier 3). Each tier eliminates the skew, protects your p99 latency, and right-sizes your cloud bill.
Read More
If you're working on Docker and CI pipelines, you may also like:
- How to Avoid GitHub Token Rate Limiting Issues — Practical ways to handle GitHub token rate limits in CI.
- This One YAML Key Makes GitHub Actions Workflow Runs Easy to Identify — Make CI workflow runs easier to identify with
run-name. - Terraform with AI: Build AWS Infra (Cursor + MCP) — Use AI, Cursor, and MCP Server in Terraform workflows.
Is your Kubernetes platform over-provisioning compute due to traffic skew or autoscaling misconfigurations? KubeNine runs deep-dive traffic architecture and FinOps audits to eliminate cloud waste and improve workload reliability.