
On this page
How We Connected Google Managed Prometheus to Grafana Using Docker Compose
Learn how we integrated Grafana with Google Managed Prometheus using Docker Compose for a lightweight, production-ready observability setup.

Introduction
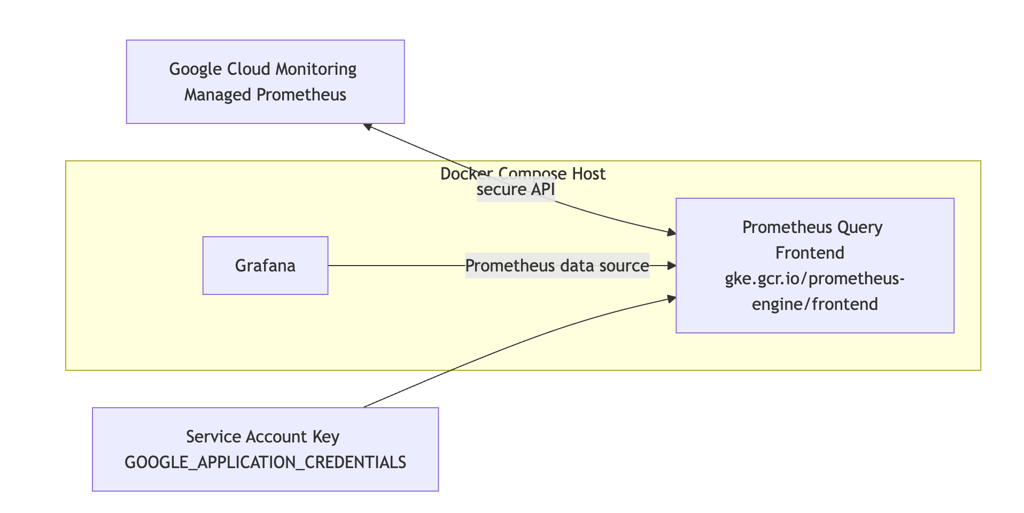
Google Cloud Managed Prometheus (GMP) lets you store and query Prometheus metrics in Google Cloud Monitoring without running your own Prometheus servers. If you want a familiar Prometheus-style experience in Grafana, you can run the Prometheus query frontend container locally and point Grafana’s Prometheus data source at it. The query frontend authenticates to Google Cloud using a service account and translates PromQL queries to Google Cloud Monitoring API calls.
This guide shows a minimal, production-friendly setup using Docker Compose. You’ll create a least-privilege service account, run the managed Prometheus query frontend, and connect Grafana to it. The end result: you can explore your Google Cloud metrics with PromQL in Grafana, without operating Prometheus storage yourself.
Prerequisites
- Docker and Docker Compose installed
- Google Cloud project ID where your GMP metrics live
- gcloud CLI authenticated with permissions to create service accounts and IAM bindings
Create a service account and key (least privilege)
Replace PROJECT_ID with your Google Cloud project ID.
gcloud config set project PROJECT_ID

# Create a dedicated service account for Grafana → GMP reads
gcloud iam service-accounts create grafana-gmp-reader \
  --display-name="Grafana GMP Reader"

# Grant read-only access to metrics
gcloud projects add-iam-policy-binding PROJECT_ID \
  --member="serviceAccount:grafana-gmp-reader@PROJECT_ID.iam.gserviceaccount.com" \
  --role="roles/monitoring.viewer"

# Enable the Monitoring API if not already enabled
gcloud services enable monitoring.googleapis.com

# Create a JSON key (store securely!)
gcloud iam service-accounts keys create service-account-key.json \
  --iam-account=grafana-gmp-reader@PROJECT_ID.iam.gserviceaccount.com
Security notes:
- Prefer avoiding long-lived keys in production. If you’re running on GKE or GCE, use Workload Identity instead of keys. For hybrid/self-hosted, consider Workload Identity Federation.
- Scope permissions to only the projects you need. roles/monitoring.viewer is typically sufficient for read-only querying.
Docker Compose for Grafana and the Prometheus query frontend
Create a docker-compose.yaml with the following content. Replace YOUR_GCP_PROJECT_ID with your project and point the volume to your downloaded key file.
version: '3.8'

services:
  grafana:
    image: grafana/grafana:latest
    container_name: grafana
    ports:
      - "3000:3000"
    environment:
      - GF_SECURITY_ADMIN_USER=admin
      - GF_SECURITY_ADMIN_PASSWORD=change-me
    volumes:
      - grafana-storage:/var/lib/grafana
    restart: unless-stopped

  prometheus:
    image: gke.gcr.io/prometheus-engine/frontend:v0.15.3-gke.0
    container_name: gmp-query-frontend
    ports:
      - "9090:9090"
    environment:
      - GMP_PROJECT=YOUR_GCP_PROJECT_ID
      - GOOGLE_APPLICATION_CREDENTIALS=/etc/gcp/service-account-key.json
    volumes:
      - ./service-account-key.json:/etc/gcp/service-account-key.json:ro
    command:
      - "--web.listen-address=:9090"
      - "--query.project-id=YOUR_GCP_PROJECT_ID"
    restart: unless-stopped

volumes:
  grafana-storage:
Bring the stack up:
docker compose up -dConfigure Grafana to use the Prometheus query frontend
- Open Grafana at <http://localhost:3000> (default user admin, password you set).
- Navigate to Connections → Data sources → Add data source → Prometheus.
- Set URL to <http://prometheus:9090> (the Docker Compose service name and port).
- Save & test.
Validate with a simple query
In Grafana Explore, select the Prometheus data source and try queries such as:
upIf you have GMP scraping configured in your project, you can also try common container metrics like:
container_cpu_usage_seconds_totalIf queries return no data, double-check:
- The project ID in Docker Compose flags and GMP_PROJECT
- The service account role (roles/monitoring.viewer)
- That Google Managed Prometheus is ingesting metrics in your project
FAQ
What is Google Managed Prometheus?
Google Managed Prometheus (GMP) is a fully managed monitoring solution from Google Cloud that lets teams collect, store, and query Prometheus metrics without operating Prometheus infrastructure manually.
Why connect Grafana to Google Managed Prometheus?
Connecting Grafana to Google Managed Prometheus allows teams to visualize cloud metrics, run PromQL queries, create dashboards, and build centralized observability workflows.
Why use Docker Compose for Grafana setup?
Docker Compose simplifies Grafana deployment by running observability components as lightweight containers with easier configuration management and local development workflows.
Is Google Managed Prometheus suitable for production monitoring?
Yes. Google Managed Prometheus is designed for scalable production monitoring and integrates directly with Google Cloud Monitoring while supporting PromQL-compatible querying.
What permissions are required for Grafana to access GMP?
Grafana typically requires a Google Cloud service account with monitoring read permissions such as roles/monitoring.viewer to securely query metrics from Google Cloud Monitoring.
Conclusion
With a lightweight Docker Compose setup, you can explore Google Cloud Managed Prometheus metrics in Grafana using standard PromQL—no Prometheus storage to manage. Keep credentials safe, prefer identity-based access over keys where possible, and consider provisioning for repeatable environments. From here, import or build dashboards targeting <http://prometheus:9090> and iterate on your observability views.
Read More
- How to Create a Custom Healthy Backend Count Metric in GCP
https://www.kubeblogs.com/how-to-create-a-custom-healthy-backend-count-metric-in-gcp-fixing-the-aws-healthyhostcount-gap/ - GCP Permissions and Scopes for Compute Engine VMs Explained
https://www.kubeblogs.com/gcp-permissions-and-scopes-for-compute-engine-vms/ - How to Securely Expose Your Applications Using Cloudflare Tunnel
https://www.kubeblogs.com/how-to-securely-expose-your-applications-using-cloudflare-tunnel-step-by-step-guide/