
Table of Contents
Introduction
Running workloads on Amazon EKS Fargate is great—you get a serverless container environment without worrying about EC2 nodes. But that also raises a question: how do you centralize logs when there are no nodes to install log agents on?
In a normal Kubernetes cluster, you’d run Fluent Bit as a DaemonSet on every node to collect logs. With Fargate, that’s not possible because there are no nodes to manage. So in a Fargate EKS cluster, to solve this problem, AWS automatically injects a Fluent Bit sidecar into your pods when you enable logging through a special ConfigMap.
You don’t have to modify application code or pod specs—AWS manages the sidecar for you. Configure things once, and every pod automatically ships logs to CloudWatch. This blog walks through how to set it up and how the flow works behind the scenes.
Why Fargate Logging Differs from Traditional Kubernetes
On EC2-backed clusters, Fluent Bit DaemonSets read logs directly from the node’s filesystem. That works because you control the nodes.
Fargate is different. Each pod runs in its own isolated environment, with no access to host nodes and no way to deploy DaemonSets. To fill this gap, AWS uses automatic Fluent Bit sidecar injection.
When you create a ConfigMap named aws-logging in the aws-observability namespace, EKS detects it and injects a Fluent Bit container into every Fargate pod that matches your Fargate profile selectors. The sidecar reads your pod’s logs and sends them to CloudWatch—completely automatically.
Understanding the Architecture
The EKS Fargate logging architecture consists of four key components working together:
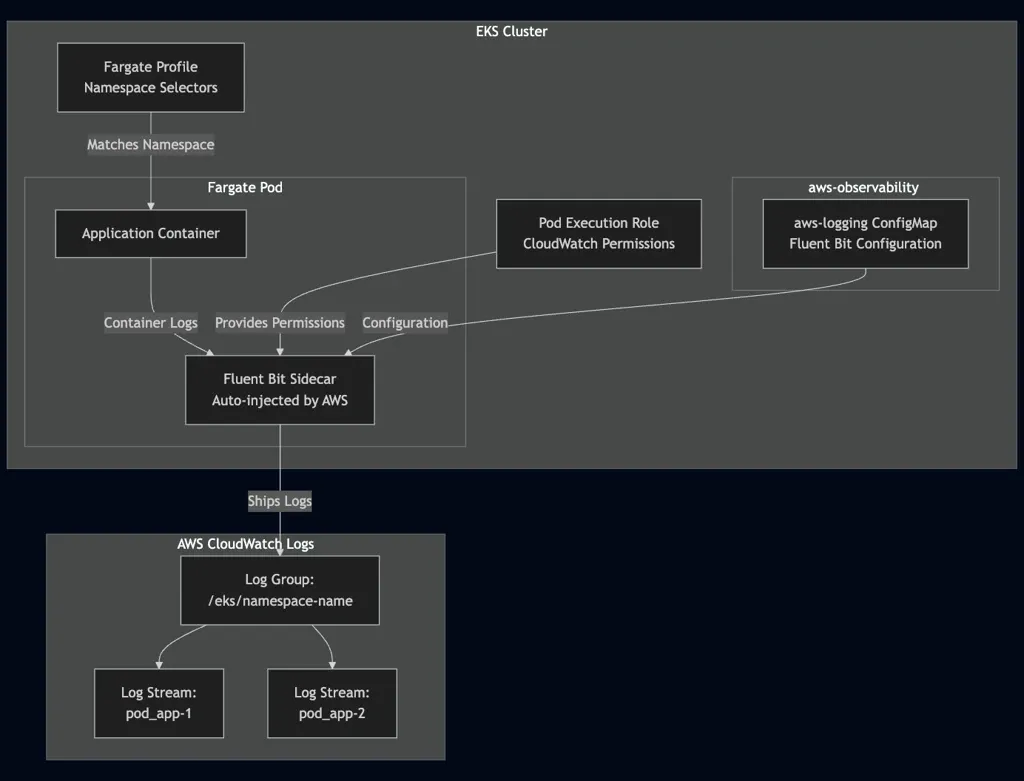
Component Breakdown:
- AWS Observability Namespace: A special namespace (
aws-observability) that AWS monitors for logging configuration. This namespace must exist with a specific label. - AWS Logging ConfigMap: Contains the Fluent Bit configuration that defines how logs are collected, processed, and shipped. Must be named exactly
aws-loggingand cannot exceed 5,300 characters. - Fargate Profile: Defines which namespaces should have Fargate pods with logging enabled through namespace selectors.
- IAM Permissions: The pod execution role attached to your Fargate profile needs CloudWatch Logs permissions to write logs.
Prerequisites
Before starting, ensure you have:
- An EKS cluster with at least one Fargate profile configured
kubectlconfigured to access your clustereksctlinstalled (for managing Fargate profiles)- AWS CLI configured with appropriate permissions
- A pod execution role for your Fargate profile
- IAM permissions to create policies and attach them to roles
Implementation Guide
Step 1: Create the AWS Observability Namespace
AWS EKS monitors the aws-observability namespace for logging configuration. Create this namespace with the required label:
apiVersion: v1
kind: Namespace
metadata:
  name: aws-observability
  labels:
    aws-observability: enabled
Apply and verify:
kubectl apply -f aws-observability-namespace.yaml
kubectl get namespace aws-observability -o jsonpath='{.metadata.labels.aws-observability}'
# Should output: enabled
Step 2: Create the AWS Logging ConfigMap
Create the aws-logging ConfigMap with your Fluent Bit configuration. This ConfigMap must be named exactly aws-logging and placed in the aws-observability namespace.
apiVersion: v1
kind: ConfigMap
metadata:
  name: aws-logging
  namespace: aws-observability
data:
  fluent-bit.conf: |
    [SERVICE]
        Flush                     5
        Log_Level                 info
        HTTP_Server               On
        HTTP_Port                 2020

    [INPUT]
        Name                tail
        Tag                 application.*
        Path                /var/log/containers/*.log
        multiline.parser    docker, cri
        Mem_Buf_Limit       50MB
        storage.type        filesystem

    [FILTER]
        Name                kubernetes
        Match               application.*
        Merge_Log           On
        Labels              On

    [FILTER]
        Name                grep
        Match               *
        Regex               $kubernetes['namespace_name'] production

    [OUTPUT]
        Name                cloudwatch_logs
        Match               application.*
        region              us-east-1
        log_group_name      /eks/production
        log_stream_template $kubernetes['pod_name']
        log_stream_prefix   pod_
        auto_create_group   false
Replace production with your target namespace and us-east-1 with your AWS region. Apply the ConfigMap:
kubectl apply -f aws-logging-configmap.yaml
kubectl get configmap aws-logging -n aws-observability
Step 3: Configure Your Fargate Profile
Ensure your Fargate profile includes the namespaces where you want logging enabled. The profile selectors determine which namespaces will have Fargate pods with automatic logging.
apiVersion: eksctl.io/v1alpha5
kind: ClusterConfig
metadata:
  name: my-cluster
  region: us-east-1

fargateProfiles:
  - name: production-profile
    selectors:
      - namespace: production
    podExecutionRoleARN: arn:aws:iam::123456789012:role/eks-fargate-pod-execution-role
Create or update the profile:
eksctl create fargateprofile --config-file fargate-profile.yamlStep 4: Configure IAM Permissions
The pod execution role needs permissions to write logs to CloudWatch. Create an IAM policy:
{
    "Version": "2012-10-17",
    "Statement": [
        {
            "Effect": "Allow",
            "Action": [
                "logs:CreateLogGroup",
                "logs:CreateLogStream",
                "logs:PutLogEvents",
                "logs:DescribeLogStreams",
                "logs:DescribeLogGroups"
            ],
            "Resource": "arn:aws:logs:us-east-1:123456789012:log-group:/eks/*"
        }
    ]
}
Create and attach the policy:
aws iam create-policy \
    --policy-name EKSFargateLoggingPolicy \
    --policy-document file://iam-policy.json

aws iam attach-role-policy \
    --role-name eks-fargate-pod-execution-role \
    --policy-arn arn:aws:iam::123456789012:policy/EKSFargateLoggingPolicy
Step 5: Create CloudWatch Log Group
If auto_create_group is set to false, create the log group manually:
aws logs create-log-group --log-group-name /eks/productionStep 6: Deploy and Verify
Deploy a test pod and verify the sidecar is injected:
kubectl run test-app --image=nginx -n production
kubectl get pod test-app -n production -o jsonpath='{.spec.containers[*].name}'
# Should show: test-app aws-observability
Check logs in CloudWatch:
aws logs tail /eks/production --followConfiguration Best Practices
Namespace Filtering
Filter logs by namespace to avoid collecting unnecessary logs:
[FILTER]
    Name    grep
    Match   *
    Regex   $kubernetes['namespace_name'] production
Exclude System Pods
Prevent collecting logs from system components:
[INPUT]
    Name        tail
    Exclude_Path /var/log/containers/cloudwatch-agent*, \
                 /var/log/containers/fluent-bit*, \
                 /var/log/containers/aws-node*
Resource Management
[INPUT]
    Mem_Buf_Limit   50MB
    storage.type    filesystem
Filesystem storage persists state across restarts, preventing log duplication.
Multi-Namespace Support
For multiple namespaces, use multiple output sections:
[OUTPUT]
    Name            cloudwatch_logs
    Match           production.*
    log_group_name  /eks/production

[OUTPUT]
    Name            cloudwatch_logs
    Match           staging.*
    log_group_name  /eks/staging
How the Logging Flow Works
The logging process follows a sequence of automated steps:
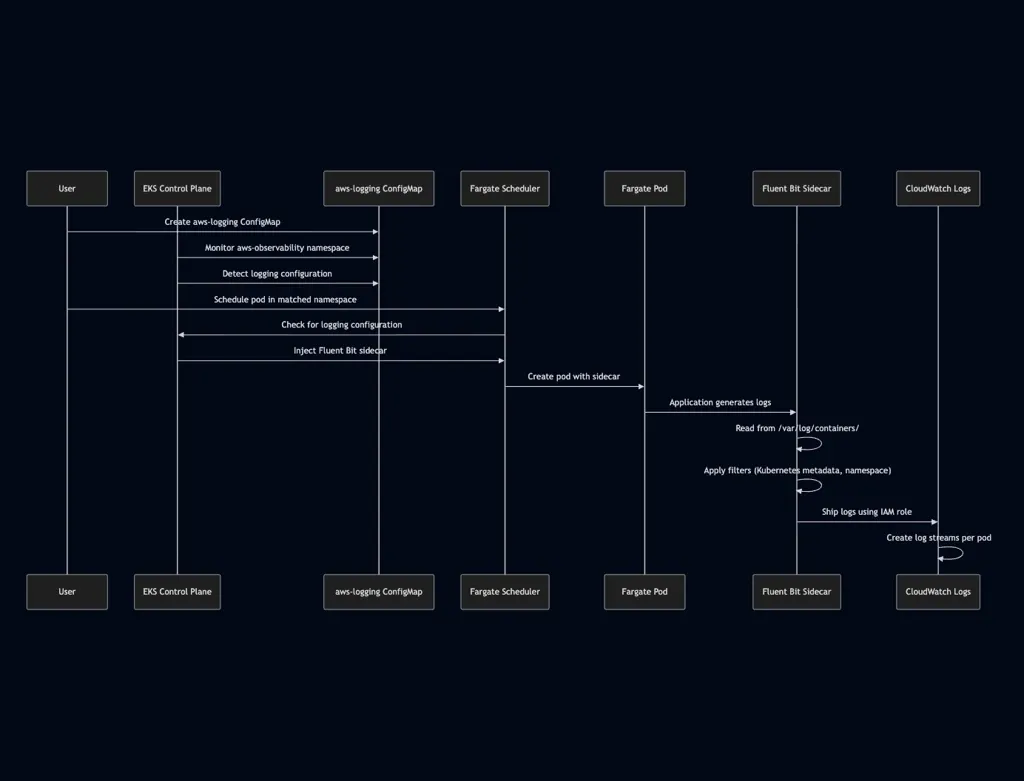
Detailed Flow:
- Configuration Detection: AWS EKS continuously monitors the
aws-observabilitynamespace. When it detects theaws-loggingConfigMap, it reads the Fluent Bit configuration. - Pod Scheduling: When a pod is scheduled in a namespace that matches your Fargate profile selectors, EKS checks if logging configuration exists.
- Sidecar Injection: AWS automatically injects a Fluent Bit sidecar container into the pod using the configuration from the
aws-loggingConfigMap. This happens transparently—no pod modifications required. - Log Collection: Fluent Bit reads logs from
/var/log/containers/on the Fargate pod, which contains all container logs in JSON format. - Log Processing: Fluent Bit applies configured filters to enrich logs with Kubernetes metadata, filter by namespace, and transform log entries as needed.
- Log Shipping: Fluent Bit sends processed logs to CloudWatch Logs using the IAM role attached to the Fargate profile. Log streams are created automatically based on pod names.
The entire process requires no modifications to your application code or pod specifications. AWS manages the sidecar lifecycle, ensuring it starts and stops with your application containers.
Important Considerations
Fargate-Only Solution
This approach works exclusively for Fargate pods. If you have EC2-based node groups in your cluster, you'll need a separate logging solution using Fluent Bit DaemonSets.
Namespace Requirement
The configuration namespace must be named exactly aws-observability with the label aws-observability: enabled. This is a hard requirement enforced by AWS.
Region Specificity
The CloudWatch Logs configuration is tied to a specific AWS region. For multi-region clusters, create separate ConfigMaps for each region.
Log Group Management
If auto_create_group is set to false, create log groups manually before logs can be shipped. This provides better control over log retention policies and access controls.
Cost Optimization
CloudWatch Logs charges based on ingestion volume and storage. For high-volume applications, implement log filtering at the Fluent Bit level to reduce unnecessary log shipping and control costs.
Conclusion
Implementing centralized logging for EKS Fargate workloads using Fluent Bit and CloudWatch Logs provides a managed solution with minimal overhead. The sidecar injection mechanism removes the need to modify application deployments while ensuring consistent log collection across all Fargate pods.
The key to successful implementation lies in proper configuration of the aws-logging ConfigMap, correct Fargate profile setup, and appropriate IAM permissions. By following the steps outlined in this guide and applying the best practices, you can establish a reliable logging pipeline for your Fargate workloads.
KubeNine specializes in Kubernetes observability solutions and can help design and implement logging strategies tailored to your specific requirements. Visit kubenine.com to learn more about our Kubernetes and observability consulting services.
Recent Posts