Table of Contents
Why This Question Is Appearing in Many DevOps Teams
If you operate Kubernetes in production, there is a good chance you already have a log collector running on every node.
For many teams, that collector is Fluent Bit.
Fluent Bit has been the default choice for Kubernetes logging for years because it is extremely lightweight and reliable. It runs quietly as a DaemonSet and ships logs to systems like Loki, Elasticsearch, or Splunk.
However, observability stacks are evolving. Platforms are no longer collecting only logs. Most modern systems also collect:
- metrics
- distributed traces
- sometimes profiling data
With the rise of OpenTelemetry, unified collectors like Grafana Alloy are becoming more common.
Because Grafana Alloy can collect logs, metrics, and traces, a natural question appears:
If Alloy already collects logs, do we still need Fluent Bit?
The short answer is: often yes — but for specific reasons.
Understanding why requires looking at how observability pipelines evolved in Kubernetes environments.
How Kubernetes Logging Traditionally Worked
Before OpenTelemetry became widely adopted, Kubernetes logging followed a simple architecture.
Each node ran a lightweight log forwarder responsible for reading container log files and shipping them to a centralized backend.
Fluent Bit became the standard tool for this job.
Traditional Kubernetes Logging Pipeline
The process is straightforward:
- Containers write logs to
/var/log/containers - Fluent Bit reads those log files
- Kubernetes metadata is attached
- Logs are forwarded to a storage backend
This model works extremely well.
Many managed Kubernetes services deploy Fluent Bit by default, including:
- Amazon EKS
- Google GKE
- Azure AKS
In most teams, Fluent Bit simply runs in the background and rarely requires operational attention.
The Limitation of Multi-Agent Observability
The traditional logging architecture works well for logs, but modern observability platforms collect much more than that.
Most production systems today collect:
- logs
- metrics
- traces
Because of this, clusters often end up running multiple agents on every node.
A common node-level setup looks like this:
Fluent Bit
Prometheus Node Exporter
OpenTelemetry Agent
Profiling Collector
This introduces several operational issues.
First, every additional agent consumes CPU and memory. On nodes running many workloads, this overhead becomes noticeable.
Second, operating several independent pipelines increases configuration complexity.
Third, telemetry signals are collected by different agents, which makes correlation harder.
This is one of the reasons unified collectors started gaining attention.
The New Approach: Unified Observability Collectors
Grafana Alloy represents a different approach.
Instead of running multiple specialized agents, Alloy acts as a single collector capable of handling multiple telemetry signals.
Grafana Alloy is built on top of the OpenTelemetry Collector, but packaged and maintained by Grafana Labs.
It can collect:
- logs
- metrics
- traces
- profiling data
Unified Observability Architecture
The idea is to reduce the number of agents running in the cluster while standardizing telemetry pipelines.
For organizations adopting OpenTelemetry across their platform, this architecture can simplify observability significantly.
However, this does not automatically make Fluent Bit unnecessary.
Fluent Bit vs Grafana Alloy
Although both tools can collect logs, they are designed for different purposes.
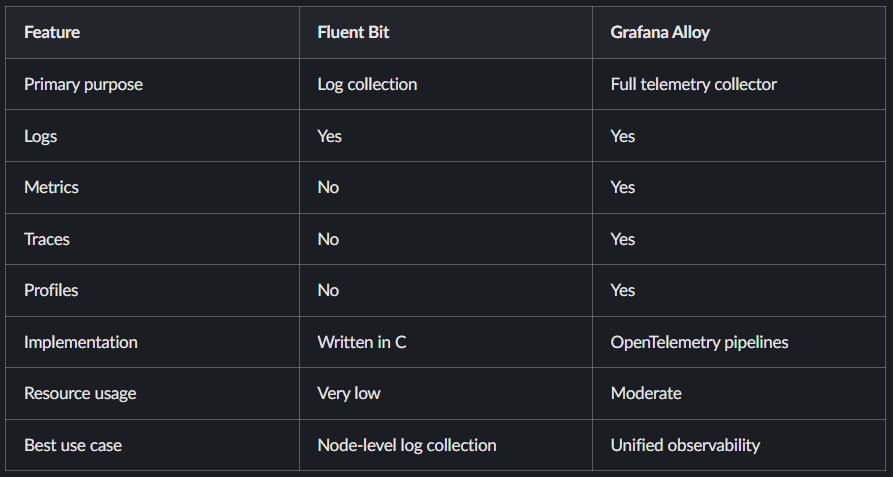
Fluent Bit focuses on doing one task extremely well.
Grafana Alloy focuses on managing full observability pipelines.
Why Fluent Bit Still Exists
Even with modern collectors available, Fluent Bit remains widely used in production environments.
There are several practical reasons for this.
1. Extremely Low Resource Usage
Fluent Bit is written in C and optimized for efficiency.
Typical resource usage in production clusters:
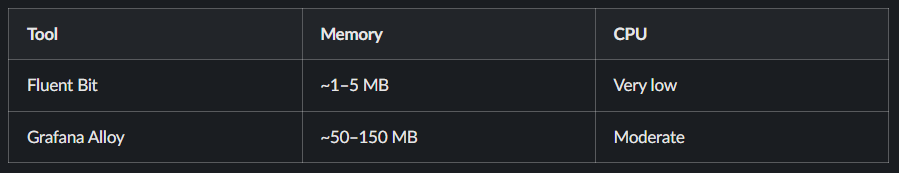
On clusters with hundreds of nodes, this difference adds up quickly.
In most teams I’ve worked with, Fluent Bit continues running as a DaemonSet simply because it has a negligible resource footprint.
2. Purpose-Built Log Pipelines
Fluent Bit’s internal pipeline is optimized specifically for log processing.
A typical processing pipeline looks like this:
Input → Filter → Parser → OutputExample flow:
Container Logs
↓
Fluent Bit Input Plugin
↓
Kubernetes Metadata Filter
↓
JSON Parser
↓
Loki / Elasticsearch
The system includes features such as:
- buffering
- retry logic
- log filtering
- Kubernetes metadata enrichment
Because the tool focuses only on logs, it performs this task extremely efficiently.
3. Mature Kubernetes Integration
Fluent Bit integrates deeply with Kubernetes logging behavior.
It understands:
- container runtime log formats
- Kubernetes metadata
- pod labels and annotations
Because of this tight integration, it has become the default logging agent for many Kubernetes platforms.
In most clusters, Fluent Bit runs as a DaemonSet on every node.
How Grafana Alloy Works Internally
Grafana Alloy builds on the OpenTelemetry Collector pipeline model.
A typical telemetry pipeline consists of three stages:
Receiver → Processor → ExporterFor example:
Logs Receiver
↓
Kubernetes Attributes Processor
↓
Batch Processor
↓
Loki Exporter
This architecture allows Alloy to process multiple telemetry signals through configurable pipelines.
While this design is flexible, it is also more resource intensive than specialized agents like Fluent Bit.
A Common Production Architecture
In many real-world platforms, teams do not fully replace Fluent Bit.
Instead, they combine both tools.
Combined Observability Architecture
In this model:
- Fluent Bit handles lightweight log collection
- Grafana Alloy processes telemetry pipelines
This pattern appears frequently in large Kubernetes environments.
Example Fluent Bit Configuration
A minimal Fluent Bit configuration for Kubernetes logging might look like this:
[INPUT]
  Name tail
  Path /var/log/containers/*.log

[FILTER]
  Name kubernetes
  Match *

[OUTPUT]
  Name loki
  Host loki.monitoring
This pipeline:
- Reads container logs
- Attaches Kubernetes metadata
- Sends logs to Loki
Most production configurations follow a similar structure.
When to Use Fluent Bit
Fluent Bit remains the better option when:
- the platform only needs log collection
- node resource usage must remain minimal
- clusters contain many nodes
- logging pipelines are simple
For pure log shipping, Fluent Bit is still one of the most efficient solutions available.
When Grafana Alloy Makes More Sense
Grafana Alloy becomes more useful when:
- the platform adopts OpenTelemetry across services
- telemetry pipelines include logs, metrics, and traces
- teams want to reduce the number of agents per node
- observability pipelines need flexibility
In these environments, Alloy can simplify pipeline management.
Final Thoughts
Grafana Alloy represents a shift toward unified observability collectors built around OpenTelemetry.
At the same time, Fluent Bit remains one of the most efficient log processors available.
Because the two tools serve different purposes, many platforms continue using both.
Fluent Bit handles lightweight node-level logging, while Grafana Alloy manages broader telemetry pipelines.
For most teams, the real decision is not Fluent Bit vs Grafana Alloy.
It is understanding where each tool fits best in the observability architecture.
FAQ
Is Grafana Alloy replacing Fluent Bit?
No. Grafana Alloy can collect logs, but Fluent Bit remains significantly lighter and is often preferred for node-level logging.
Can Grafana Alloy collect Kubernetes logs?
Yes. Grafana Alloy can collect logs through OpenTelemetry pipelines, although the resource usage is typically higher than Fluent Bit.
Should I migrate from Fluent Bit to Grafana Alloy?
Migration usually makes sense if your platform is adopting OpenTelemetry and wants unified telemetry pipelines.
Recent Posts