Table of Contents
Introduction
When running workloads on Kubernetes, collecting logs from your applications and system components is a basic necessity.
In this guide, we’ll show how to use Fluent Bit to gather logs from different sources in a Kubernetes cluster and send them to Amazon CloudWatch Logs. Fluent Bit is a small, fast log processor designed to run on each node in the cluster as a DaemonSet, collecting logs locally.
This blog covers everything you need to know: how Fluent Bit works, the required Kubernetes setup, and step-by-step configuration. Now let’s look at the architecture to understand how all the pieces fit together.
Fluent Bit Configuration Overview
This setup is built to collect logs from multiple sources inside a Kubernetes cluster, process them based on rules you define, and send the results to Amazon CloudWatch Logs.
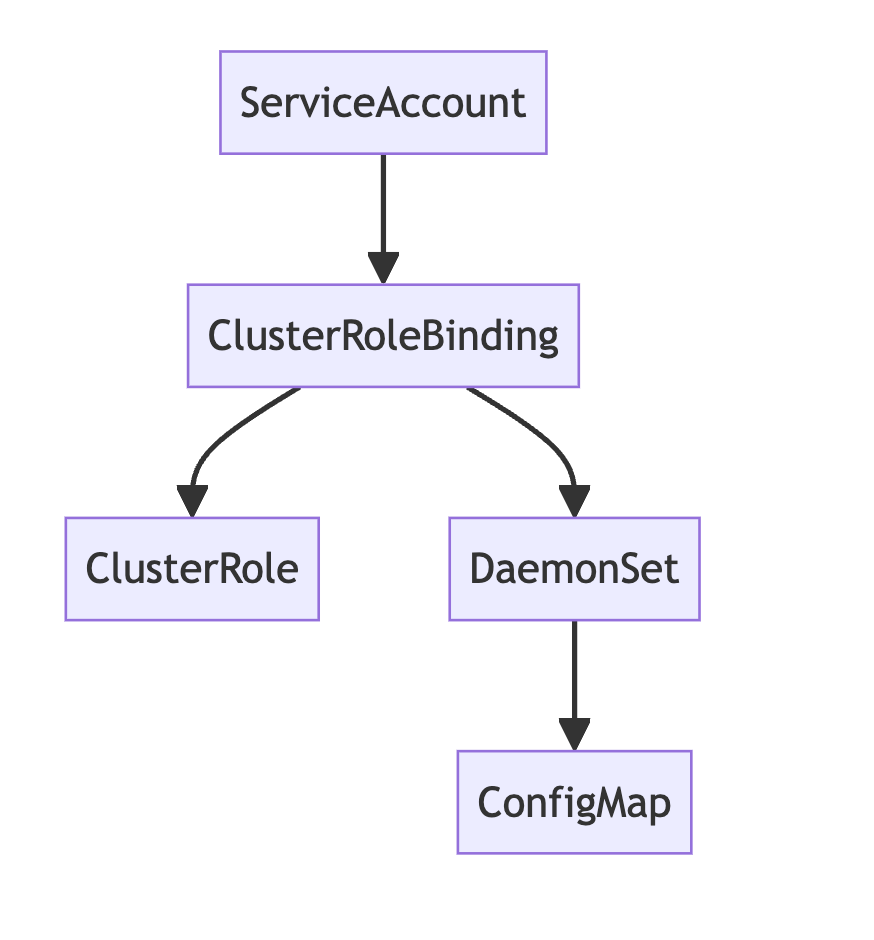
Here’s what’s included in the configuration:
- ServiceAccount – Gives Fluent Bit the identity it needs to access the Kubernetes API.
- ClusterRole and ClusterRoleBinding – Grants read permissions on pods, logs, and node metadata.
- ConfigMap – Stores Fluent Bit’s full configuration, split into inputs, filters, outputs, and parsers.
- DaemonSet – Runs one Fluent Bit pod per node to collect logs locally.
- Input Configurations – Define which logs to read (e.g., from container logs, systemd, or host files).
- Filter Configurations – Apply rules to process and enrich logs (e.g., add Kubernetes metadata, match labels, rename fields).
- Output Configurations – Specify where logs are sent (CloudWatch Logs, stdout, or other targets).
Parser Configurations – Handle different log formats using custom or built-in parsing rules.
How Fluent Bit Works in This Setup
- Log Collection: Fluent Bit reads logs from application containers, systemd services, and host-level log files.
- Log Processing: Filters apply label-based selection, add metadata, and modify log structure to prepare for export.
- Log Output: Logs are sent to CloudWatch Logs under structured log groups (application, dataplane, host), and optionally to stdout for local debugging.
What is Fluent Bit?
Fluent Bit is a lightweight log processor and forwarder built to collect, process, and send logs from a variety of sources. It’s well-suited for Kubernetes because it runs efficiently as a DaemonSet — one pod per node — and can access all logs on that node.
The way Fluent Bit works is based on a simple pipeline with three main parts:
- Input – This is where you define what logs to read. In Kubernetes, this usually means log files from containers (
/var/log/containers/*.log), systemd services, or host log files. - Filter – After collecting the logs, filters let you process and adjust them. For example, you can enrich logs with Kubernetes metadata, drop logs that don’t match a label, or rename fields to avoid conflicts.
- Output – Finally, the logs are sent to their destination. In this case, we’re sending them to Amazon CloudWatch Logs, but Fluent Bit also supports other options like files, HTTP endpoints, or logging platforms.
In simple terms: Fluent Bit reads logs, processes them according to your rules, and pushes them to the place you specify.
Here’s a basic flow:
[Log File] → [INPUT] → [FILTERS] → [OUTPUT]
In our setup, for example:
- Input might be logs from
/var/log/containers/ - Filter might include adding Kubernetes labels and keeping only logs marked with
logging=enabled - Output sends the logs to CloudWatch under a log group like
/aws/containerinsights/cluster-name/application
Step 1: Set Up AWS Credentials (for non-AWS Kubernetes clusters)
If you're running Kubernetes outside of AWS — such as on-prem or in another cloud environment — Fluent Bit won’t have access to an IAM role like it would in an EKS setup. Instead, you’ll need to provide AWS credentials directly.
1.1 Create an IAM User
In the AWS IAM console, create a new IAM user with programmatic access. Attach the following policy to grant access to CloudWatch Logs:
{
  "Version": "2012-10-17",
  "Statement": [
    {
      "Effect": "Allow",
      "Action": [
        "logs:CreateLogGroup",
        "logs:CreateLogStream",
        "logs:PutLogEvents",
        "logs:DescribeLogGroups",
        "logs:DescribeLogStreams"
      ],
      "Resource": "*"
    }
  ]
}
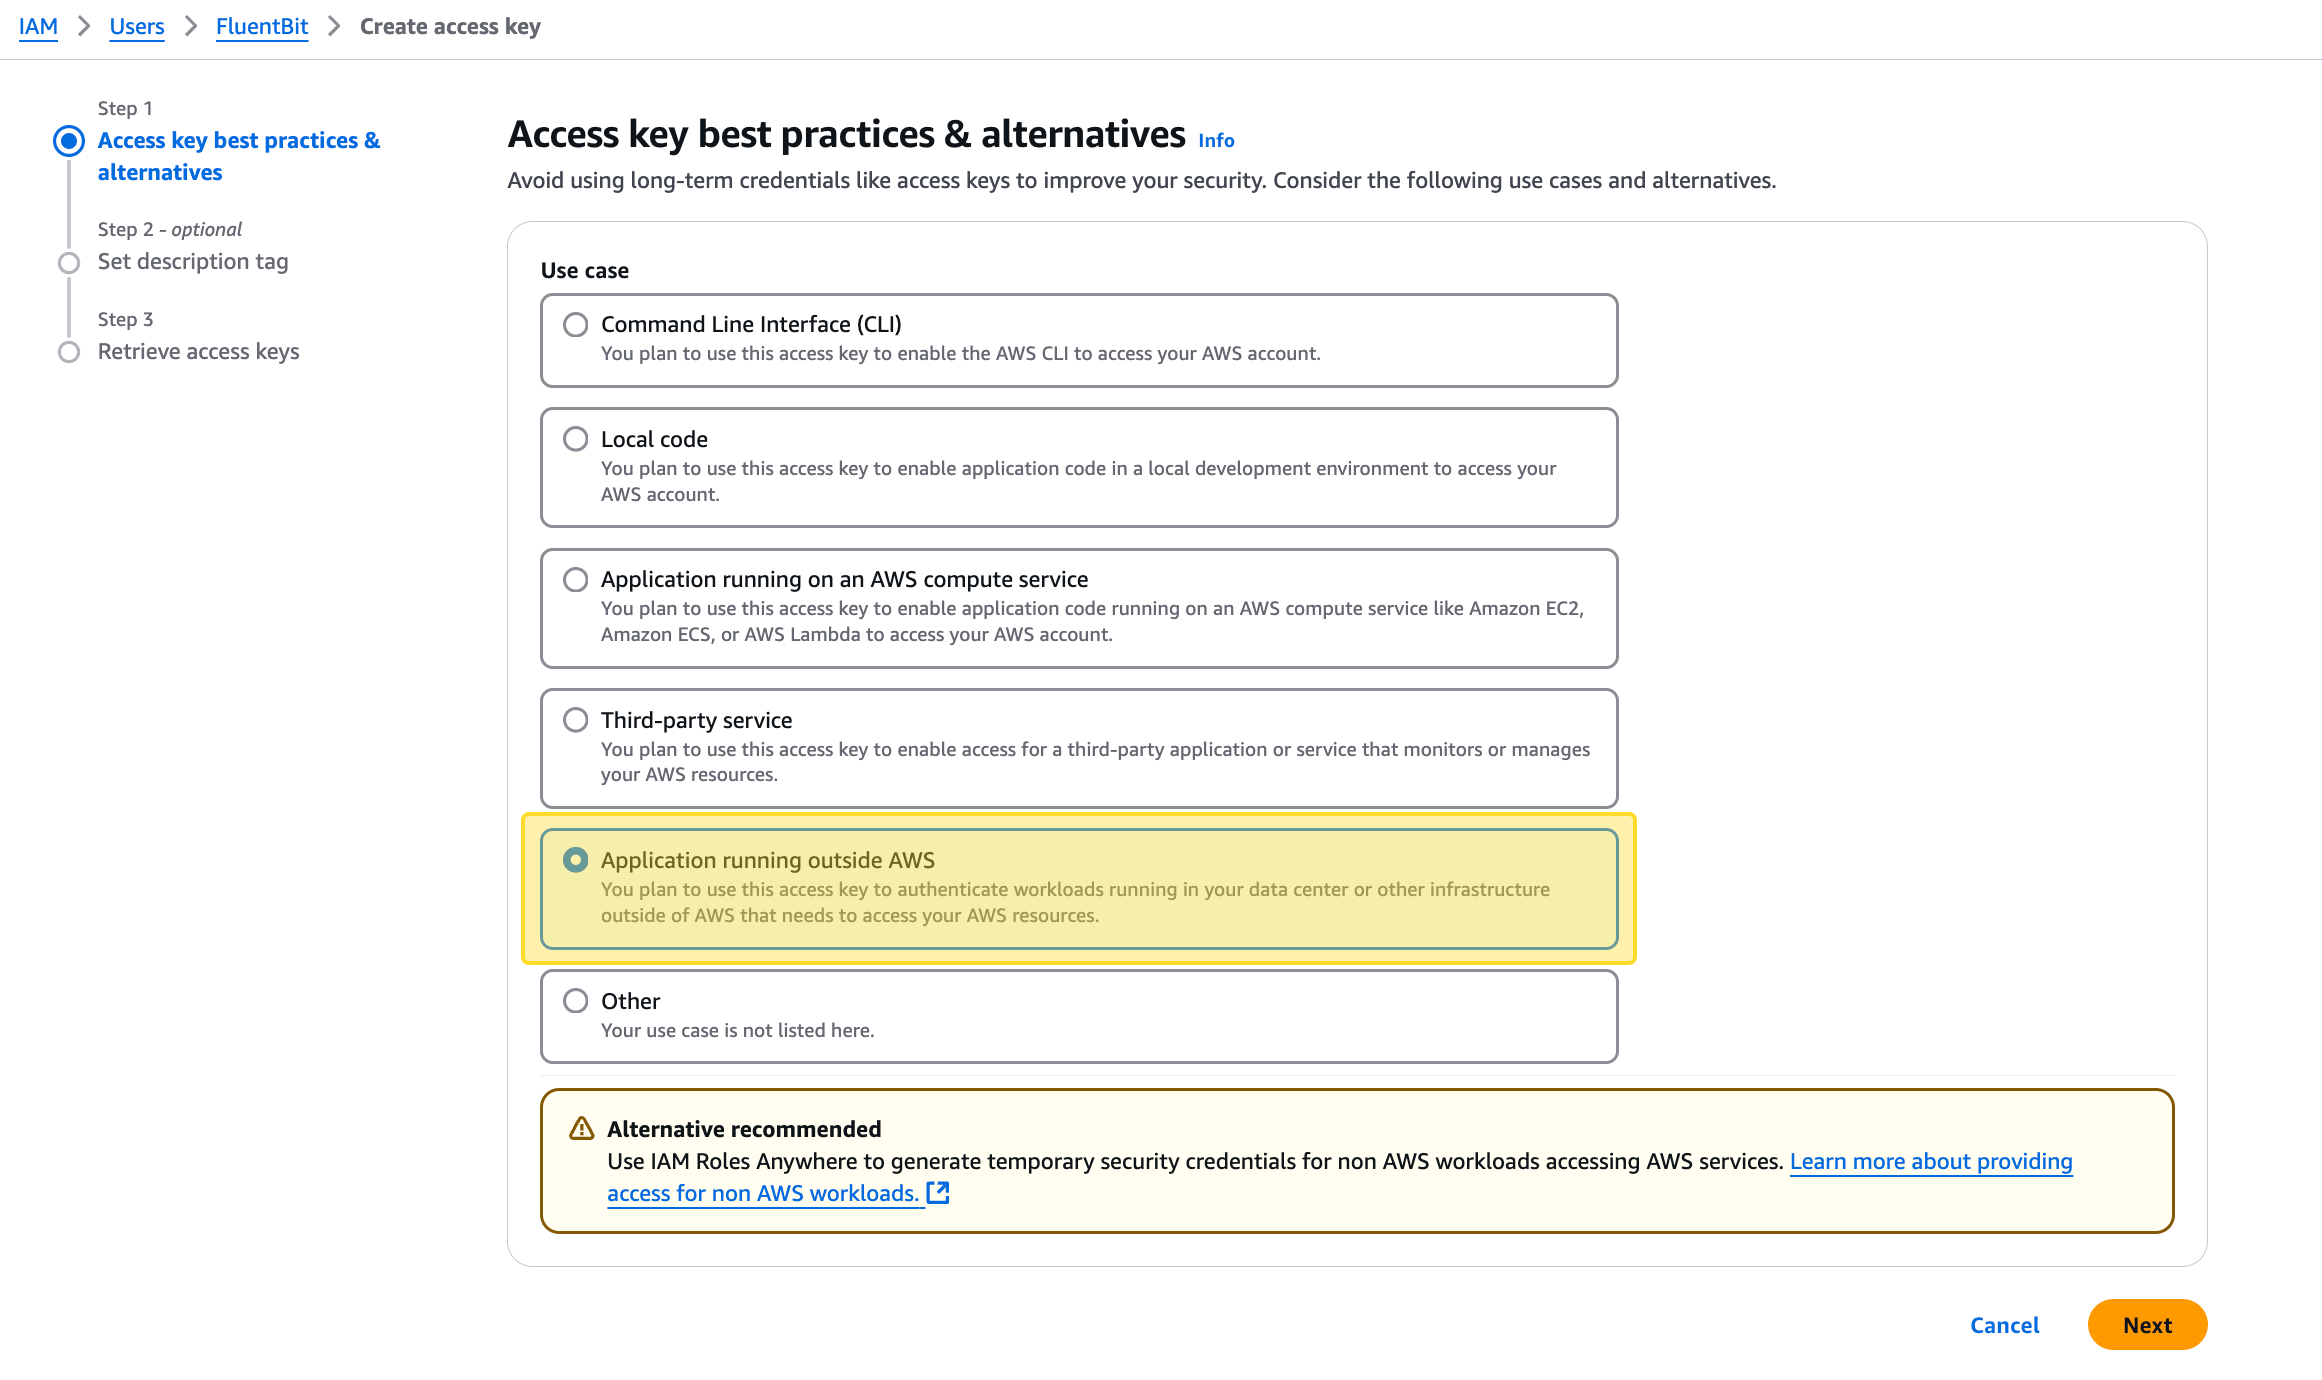
🔹 During creation, select the correct use case:
Application running outside AWS
This tells AWS you're generating a key for workloads running in external environments (e.g., bare metal, another cloud, or local machines).
1.2 Retrieve and Store the Access Keys
After completing the user creation, you’ll be shown the Access Key ID and Secret Access Key. You can only view or download the secret once, so save it securely.
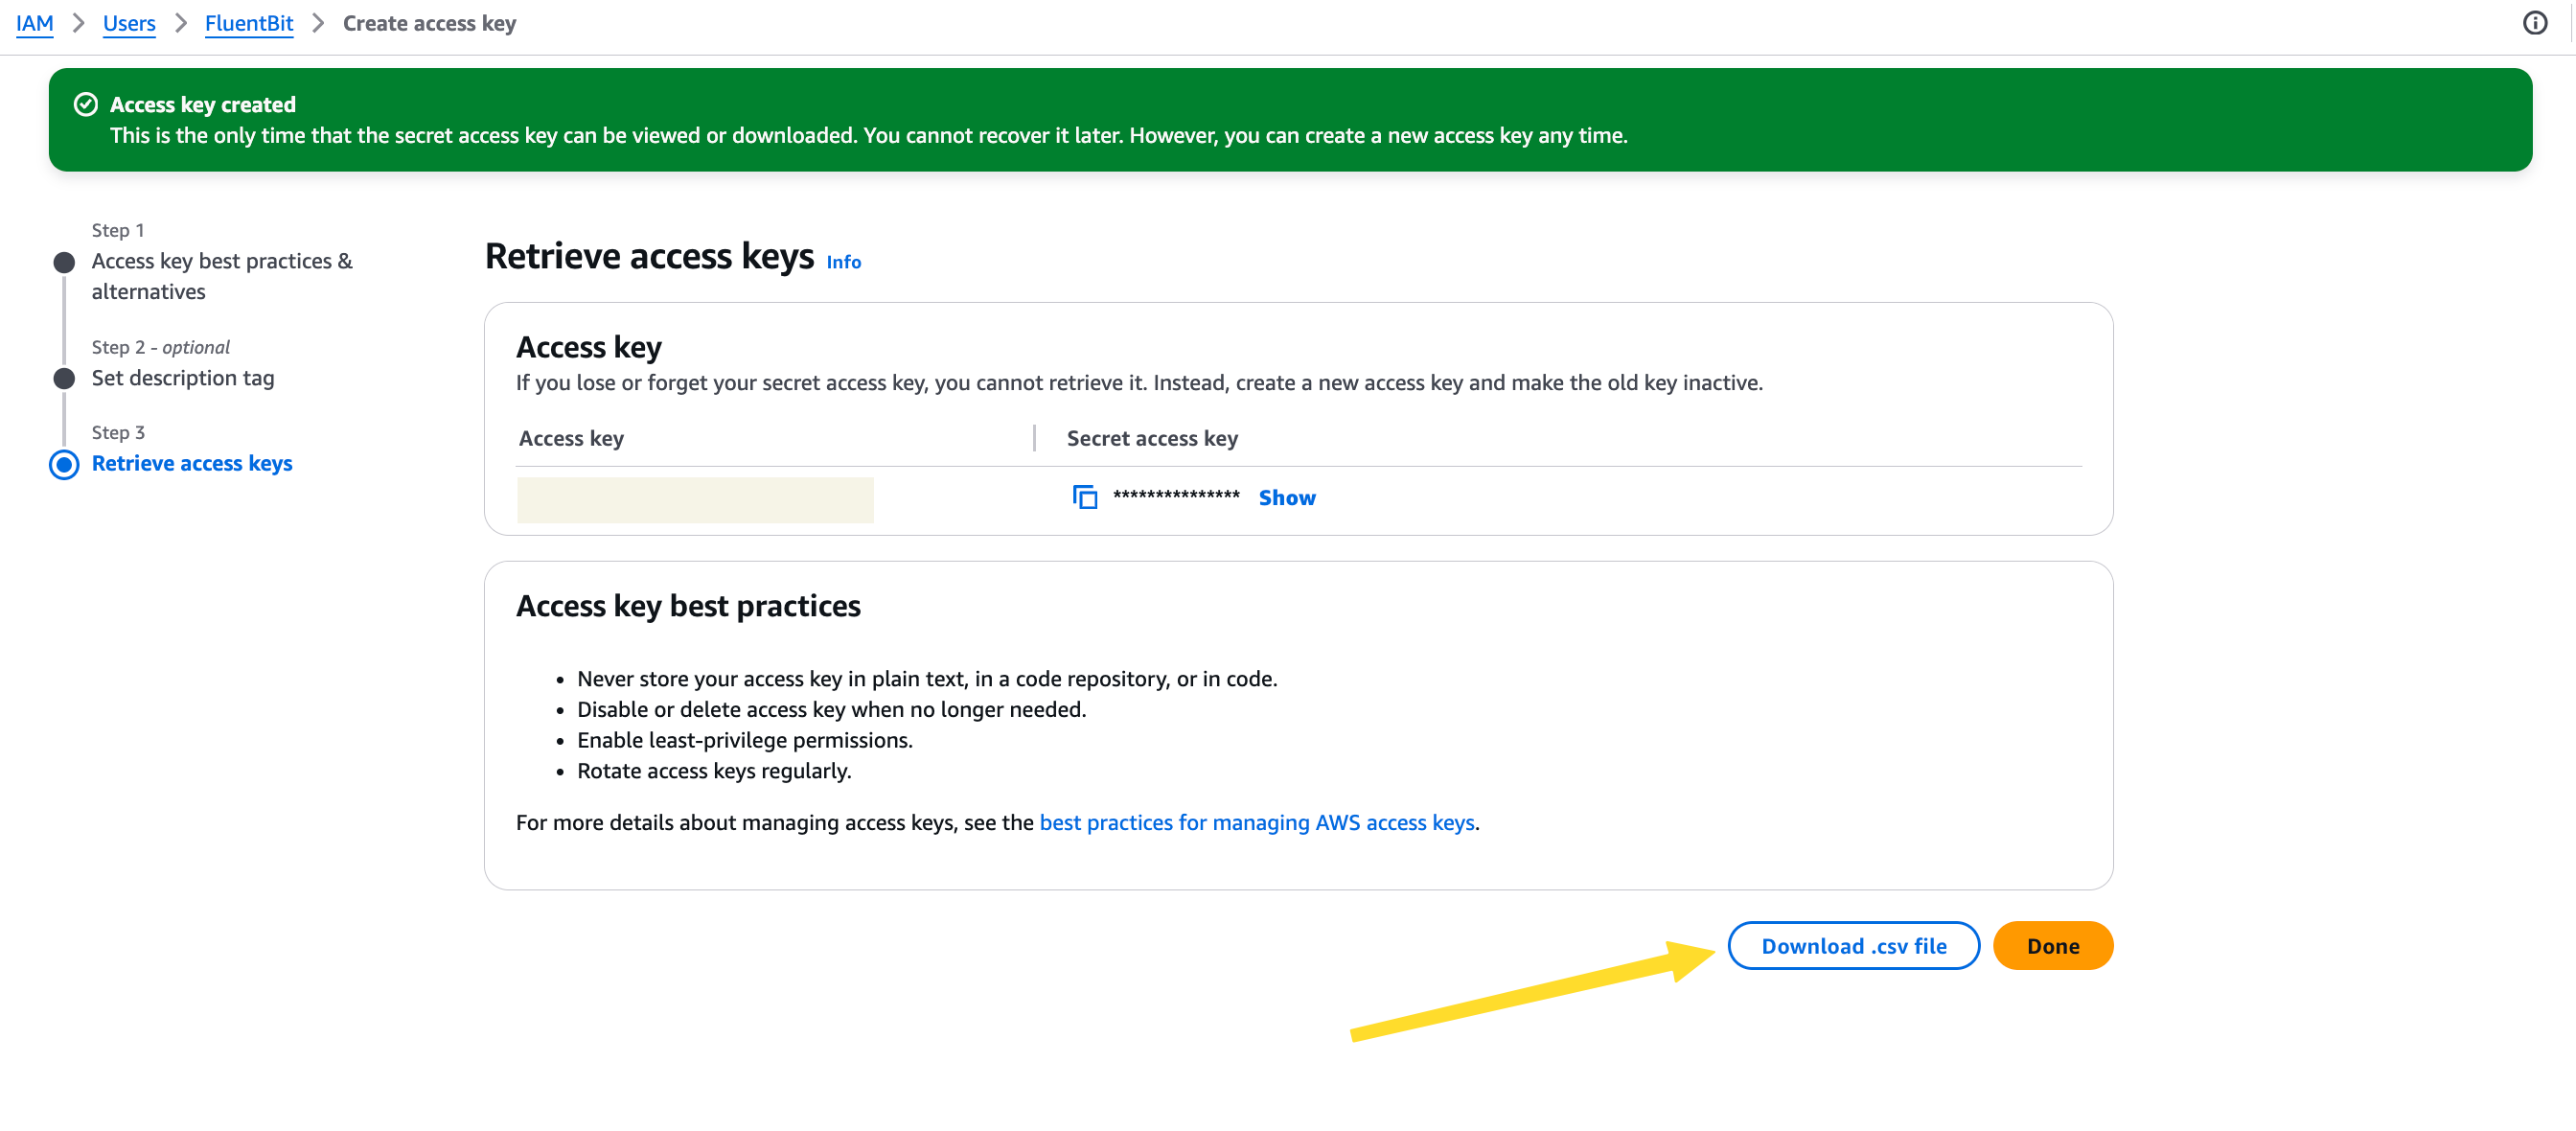
You’ll use these credentials in the next step when creating a Kubernetes secret, so Fluent Bit can authenticate with AWS.
Step 2: Create ServiceAccount and RBAC for Fluent Bit
Fluent Bit needs access to Kubernetes resources like pods, nodes, and logs so it can collect and enrich log data with metadata such as pod names, namespaces, and labels. This is done by assigning the right permissions using a ServiceAccount, ClusterRole, and ClusterRoleBinding.
This step is the same whether you're running inside AWS or on an external Kubernetes cluster.
apiVersion: v1
kind: ServiceAccount
metadata:
  name: fluent-bit
  namespace: fluent-bit
---
apiVersion: rbac.authorization.k8s.io/v1
kind: ClusterRole
metadata:
  name: fluent-bit-role
rules:
  - nonResourceURLs:
      - /metrics
    verbs:
      - get
  - apiGroups: [""]
    resources:
      - namespaces
      - pods
      - pods/logs
      - nodes
      - nodes/proxy
    verbs: ["get", "list", "watch"]
---
apiVersion: rbac.authorization.k8s.io/v1
kind: ClusterRoleBinding
metadata:
  name: fluent-bit-role-binding
roleRef:
  apiGroup: rbac.authorization.k8s.io
  kind: ClusterRole
  name: fluent-bit-role
subjects:
  - kind: ServiceAccount
    name: fluent-bit
    namespace: fluent-bit
Step 3: Define Fluent Bit Configuration with ConfigMap
Now that Fluent Bit has the necessary permissions, the next step is to configure how it collects, processes, and sends logs. This configuration is stored in a Kubernetes ConfigMap, which is mounted into the Fluent Bit pods when the DaemonSet runs.
The configuration is split into the following parts for clarity and modularity:
fluent-bit.conf– Main entry point that includes service settings and references other config filesapplication-log.conf– Handles logs from containerized applicationsdataplane-log.conf– Handles system-level components likekubelet,containerd, and CNI pluginshost-log.conf– Collects host log files like/var/log/messages,/var/log/secure, etc.parsers.conf– Custom parsers to handle formats like syslog or container-structured logs
apiVersion: v1
kind: ConfigMap
metadata:
  name: fluent-bit-config
  namespace: fluent-bit
  labels:
    k8s-app: fluent-bit
data:
  fluent-bit.conf: |
    [SERVICE]
        Flush                     5
        Grace                     30
        Log_Level                 error
        Daemon                    off
        Parsers_File              parsers.conf
        HTTP_Server               ${HTTP_SERVER}
        HTTP_Listen               0.0.0.0
        HTTP_Port                 ${HTTP_PORT}
        storage.path              /var/fluent-bit/state/flb-storage/
        storage.sync              normal
        storage.checksum          off
        storage.backlog.mem_limit 5M
    @INCLUDE application-log.conf
    @INCLUDE dataplane-log.conf
    @INCLUDE host-log.conf
  application-log.conf: |
    [INPUT]
        Name                tail
        Tag                 application.*
        Exclude_Path        /var/log/containers/cloudwatch-agent*, /var/log/containers/fluent-bit*, /var/log/containers/aws-node*, /var/log/containers/kube-proxy*, /var/log/containers/fluentd*
        Path                /var/log/containers/*.log
        multiline.parser    docker, cri
        DB                  /var/fluent-bit/state/flb_container.db
        Mem_Buf_Limit       50MB
        Skip_Long_Lines     On
        Refresh_Interval    10
        Rotate_Wait         30
        storage.type        filesystem
        Read_from_Head      ${READ_FROM_HEAD}
    [INPUT]
        Name                tail
        Tag                 application.*
        Path                /var/log/containers/fluent-bit*
        multiline.parser    docker, cri
        DB                  /var/fluent-bit/state/flb_log.db
        Mem_Buf_Limit       5MB
        Skip_Long_Lines     On
        Refresh_Interval    10
        Read_from_Head      ${READ_FROM_HEAD}
    [INPUT]
        Name                tail
        Tag                 application.*
        Path                /var/log/containers/cloudwatch-agent*
        multiline.parser    docker, cri
        DB                  /var/fluent-bit/state/flb_cwagent.db
        Mem_Buf_Limit       5MB
        Skip_Long_Lines     On
        Refresh_Interval    10
        Read_from_Head      ${READ_FROM_HEAD}
    [FILTER]
        Name                kubernetes
        Match               application.*
        Kube_URL            https://kubernetes.default.svc:443
        Kube_Tag_Prefix     application.var.log.containers.
        Merge_Log           On
        Merge_Log_Key       log_processed
        K8S-Logging.Parser  On
        K8S-Logging.Exclude Off
        Labels              Off
        Annotations         Off
        Use_Kubelet         Off
        Kubelet_Port        10250
        Buffer_Size         0
    [OUTPUT]
        Name                cloudwatch_logs
        Match               application.*
        region              ${AWS_REGION}
        log_group_name      /aws/containerinsights/${CLUSTER_NAME}/application
        log_stream_prefix   ${HOST_NAME}-
        auto_create_group   true
        extra_user_agent    container-insights
  dataplane-log.conf: |
    [INPUT]
        Name                systemd
        Tag                 dataplane.systemd.*
        Systemd_Filter      _SYSTEMD_UNIT=docker.service
        Systemd_Filter      _SYSTEMD_UNIT=containerd.service
        Systemd_Filter      _SYSTEMD_UNIT=kubelet.service
        DB                  /var/fluent-bit/state/systemd.db
        Path                /var/log/journal
        Read_From_Tail      ${READ_FROM_TAIL}
    [INPUT]
        Name                tail
        Tag                 dataplane.tail.*
        Path                /var/log/containers/aws-node*, /var/log/containers/kube-proxy*
        multiline.parser    docker, cri
        DB                  /var/fluent-bit/state/flb_dataplane_tail.db
        Mem_Buf_Limit       50MB
        Skip_Long_Lines     On
        Refresh_Interval    10
        Rotate_Wait         30
        storage.type        filesystem
        Read_from_Head      ${READ_FROM_HEAD}
    [FILTER]
        Name                modify
        Match               dataplane.systemd.*
        Rename              _HOSTNAME                   hostname
        Rename              _SYSTEMD_UNIT               systemd_unit
        Rename              MESSAGE                     message
        Remove_regex        ^((?!hostname|systemd_unit|message).)*$
    [FILTER]
        Name                aws
        Match               dataplane.*
        imds_version        v2
    [OUTPUT]
        Name                cloudwatch_logs
        Match               dataplane.*
        region              ${AWS_REGION}
        log_group_name      /aws/containerinsights/${CLUSTER_NAME}/dataplane
        log_stream_prefix   ${HOST_NAME}-
        auto_create_group   true
        extra_user_agent    container-insights
  host-log.conf: |
    [INPUT]
        Name                tail
        Tag                 host.dmesg
        Path                /var/log/dmesg
        Key                 message
        DB                  /var/fluent-bit/state/flb_dmesg.db
        Mem_Buf_Limit       5MB
        Skip_Long_Lines     On
        Refresh_Interval    10
        Read_from_Head      ${READ_FROM_HEAD}
    [INPUT]
        Name                tail
        Tag                 host.messages
        Path                /var/log/messages
        Parser              syslog
        DB                  /var/fluent-bit/state/flb_messages.db
        Mem_Buf_Limit       5MB
        Skip_Long_Lines     On
        Refresh_Interval    10
        Read_from_Head      ${READ_FROM_HEAD}
    [INPUT]
        Name                tail
        Tag                 host.secure
        Path                /var/log/secure
        Parser              syslog
        DB                  /var/fluent-bit/state/flb_secure.db
        Mem_Buf_Limit       5MB
        Skip_Long_Lines     On
        Refresh_Interval    10
        Read_from_Head      ${READ_FROM_HEAD}
    [FILTER]
        Name                aws
        Match               host.*
        imds_version        v2
    [OUTPUT]
        Name                cloudwatch_logs
        Match               host.*
        region              ${AWS_REGION}
        log_group_name      /aws/containerinsights/${CLUSTER_NAME}/host
        log_stream_prefix   ${HOST_NAME}.
        auto_create_group   true
        extra_user_agent    container-insights
  parsers.conf: |
    [PARSER]
        Name                syslog
        Format              regex
        Regex               ^(?<time>[^ ]* {1,2}[^ ]* [^ ]*) (?<host>[^ ]*) (?<ident>[a-zA-Z0-9_\/\.\-]*)(?:\[(?<pid>[0-9]+)\])?(?:[^\:]*\:)? *(?<message>.*)$
        Time_Key            time
        Time_Format         %b %d %H:%M:%S
    [PARSER]
        Name                container_firstline
        Format              regex
        Regex               (?<log>(?<="log":")\S(?!\.).*?)(?<!\\)".*(?<stream>(?<="stream":").*?)".*(?<time>\d{4}-\d{1,2}-\d{1,2}T\d{2}:\d{2}:\d{2}\.\w*).*(?=})
        Time_Key            time
        Time_Format         %Y-%m-%dT%H:%M:%S.%LZ
    [PARSER]
        Name                cwagent_firstline
        Format              regex
        Regex               (?<log>(?<="log":")\d{4}[\/-]\d{1,2}[\/-]\d{1,2}[ T]\d{2}:\d{2}:\d{2}(?!\.).*?)(?<!\\)".*(?<stream>(?<="stream":").*?)".*(?<time>\d{4}-\d{1,2}-\d{1,2}T\d{2}:\d{2}:\d{2}\.\w*).*(?=})
        Time_Key            time
        Time_Format         %Y-%m-%dT%H:%M:%S.%LZ
The Fluent Bit configuration is modular and easy to adjust. If you want to filter logs based on a specific namespace, label, or log path, you can make changes directly in the input or filter sections.
🔹 Example: Collect logs only from a specific namespace (e.g., production)
You can do this by adjusting the grep filter section:
[FILTER]
    Name    grep
    Match   *
    Regex   $kubernetes['namespace_name'] production
This change means only logs from pods running in the production namespace will be passed through to the output.
🔹 Example: Collect logs only from a specific label
Already included in the configuration is a label-based filter that checks for this:
[FILTER]
    Name    grep
    Match   *
    Regex   $kubernetes['labels']['logging'] enabled
If you add logging=enabled to any pod’s labels, logs from that pod will be collected. This allows you to opt-in only specific workloads for log shipping.
🔹 Example: Add a custom log path
If your application writes logs to a custom location outside the default container logs, you can add another [INPUT] block to point to that file:
[INPUT]
    Name        tail
    Tag         custom.logs
    Path        /var/log/my-app/*.log
    Parser      docker
    Read_from_Head  On
Just be sure that the path is mounted into the Fluent Bit pod via a hostPath volume.
Step 4: Deploy Fluent Bit as a DaemonSet
Before deploying the Fluent Bit DaemonSet, we need to define a separate ConfigMap called fluent-bit-cluster-info. This contains important environment variables such as the cluster name, region, HTTP server settings, and log reading direction.
These values are injected into the Fluent Bit container using env and configMapKeyRef.
apiVersion: v1
kind: ConfigMap
metadata:
  name: fluent-bit-cluster-info
  namespace: fluent-bit
data:
  cluster.name: kubenine
  logs.region: us-east-1
  http.server: "On"
  http.port: "2020"
  read.head: "True"
  read.tail: "True"
📝 Note: Make sure the namespace matches where you are deploying Fluent Bit (here it's fluent-bit). If you're using the default namespace, update it accordingly.
Now we can move on to Deploy Fluent Bit as a DaemonSet
Step 6: Validate That Logs Are Reaching CloudWatch
Once Fluent Bit is up and running, you’ll want to confirm that logs are being collected and sent to the right CloudWatch log groups.
Go to the CloudWatch Console → Log groups, and look for the following:

Click into one of the log groups — for example, /aws/containerinsights/kubenine/application.
Inside, you should see multiple log streams. These are created per node, per tag, or per Fluent Bit instance, depending on your configuration.
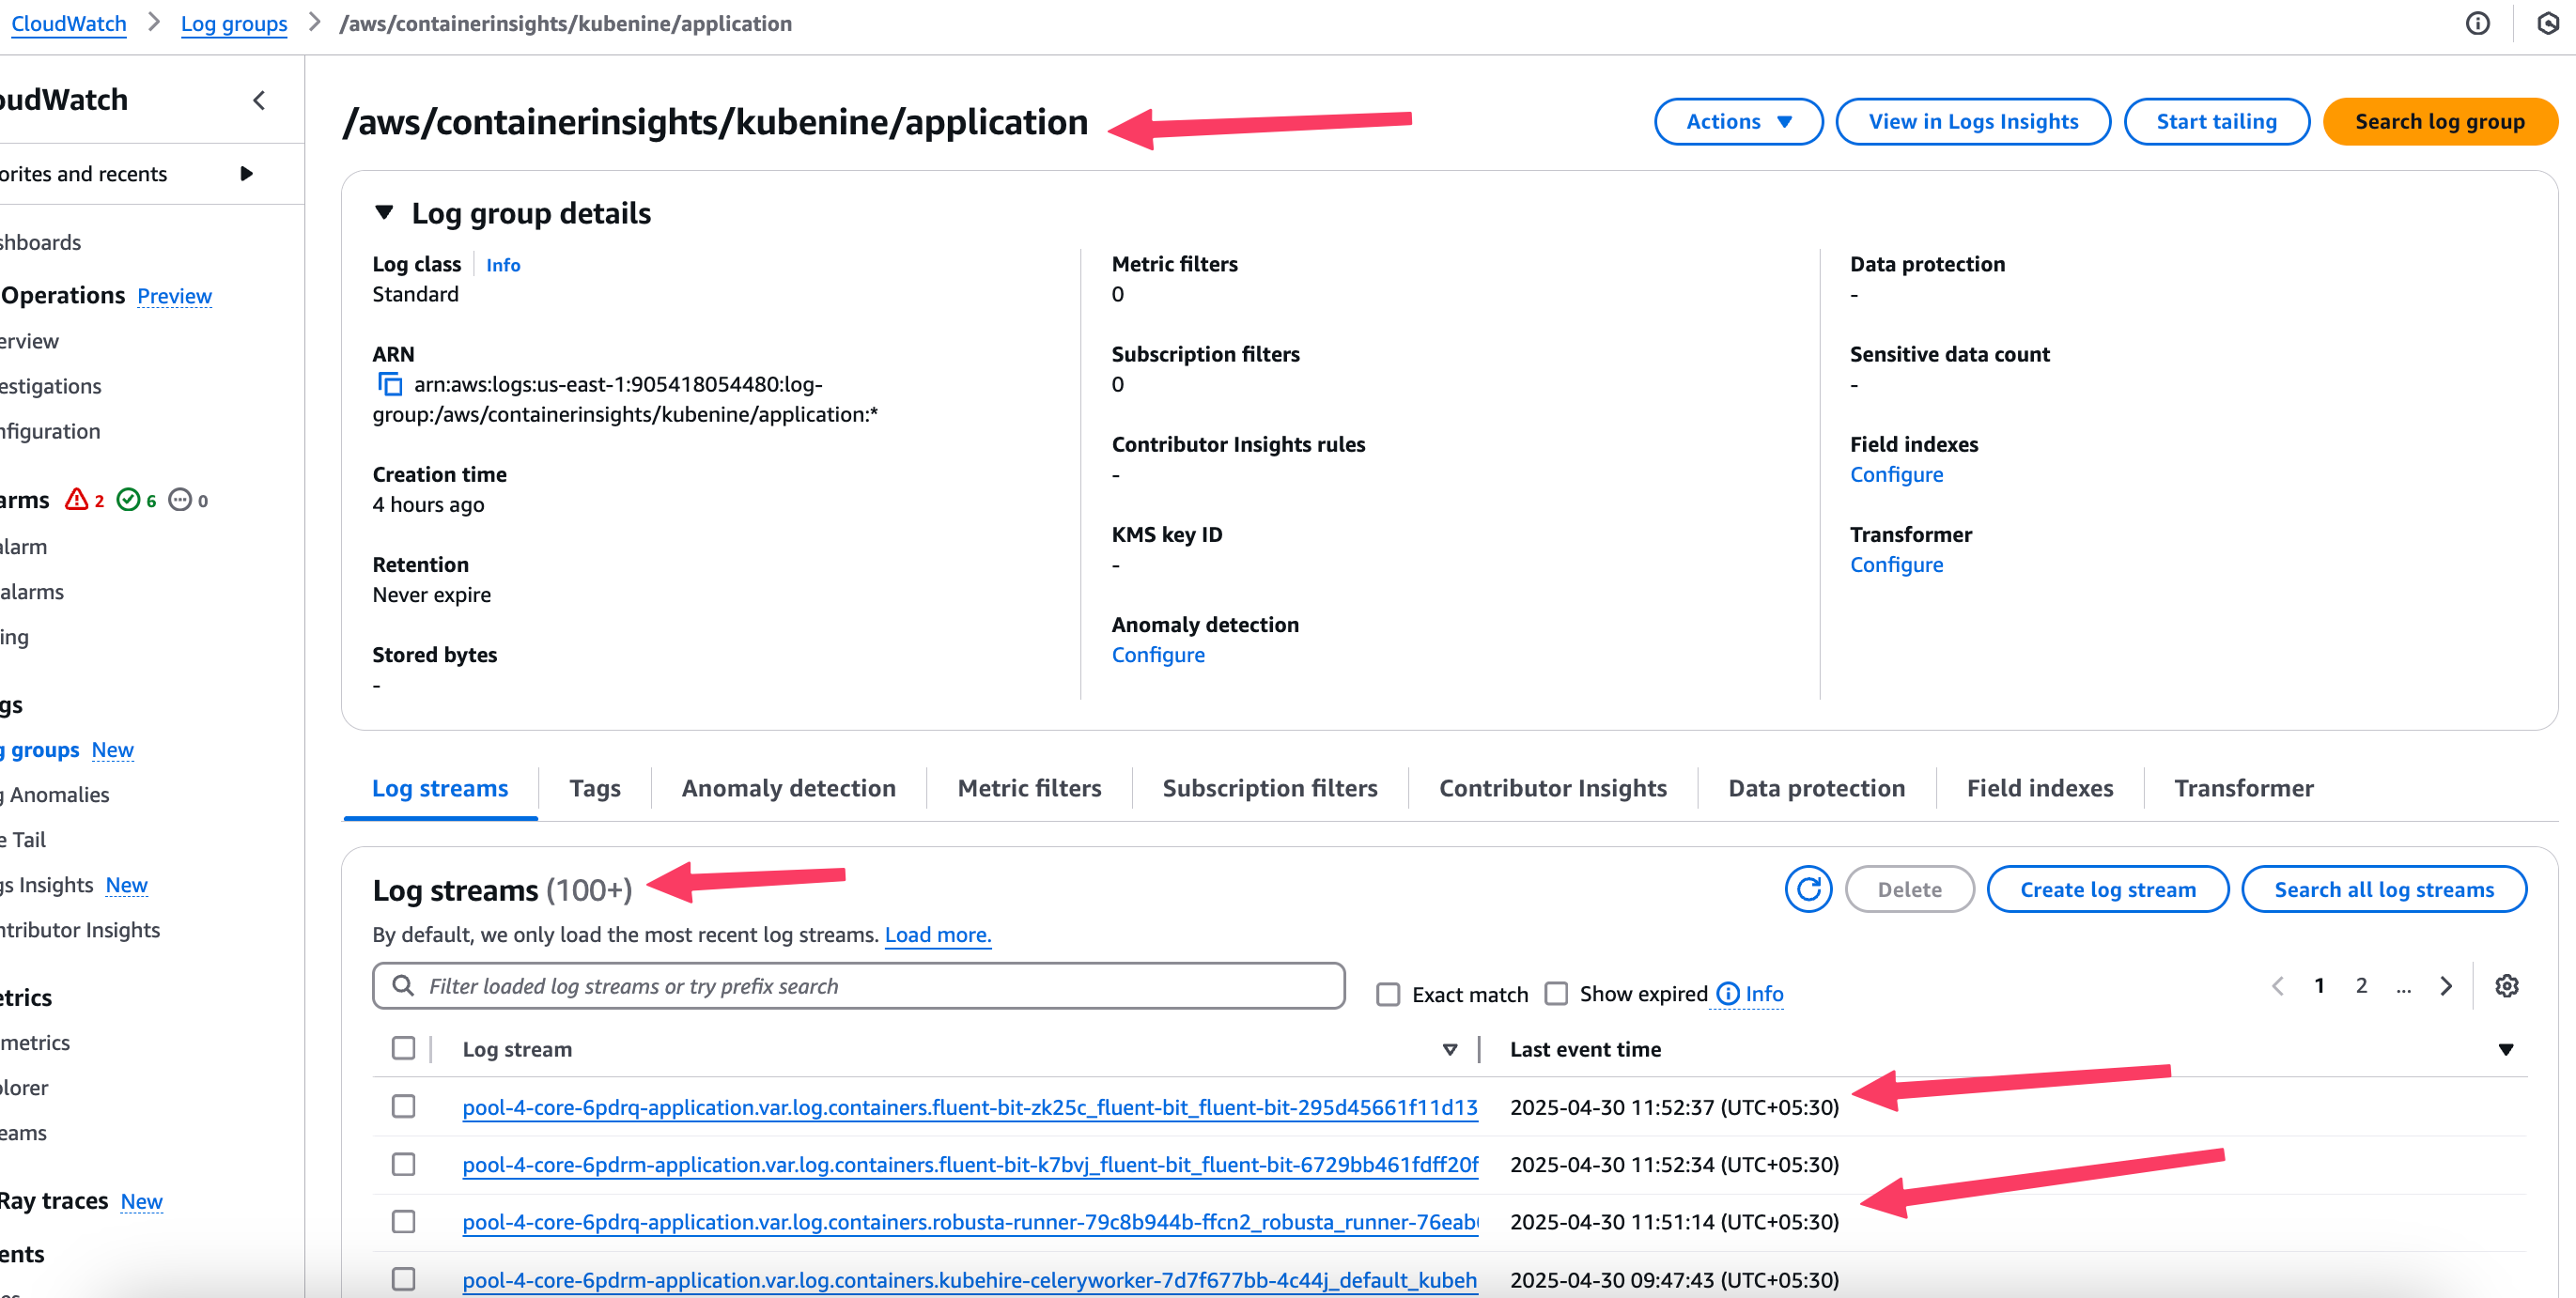
📍 Tip: If no streams are appearing, it usually means logs haven’t been sent yet — check the Fluent Bit pod logs and CloudWatch permissions.
Conclusion
In this guide, we covered how to set up Fluent Bit on a Kubernetes cluster to collect logs and send them to Amazon CloudWatch Logs. You saw how to create AWS credentials (for clusters outside AWS), build a modular configuration using ConfigMaps, deploy Fluent Bit as a DaemonSet, and confirm that logs are reaching CloudWatch.
By the end of this setup, Fluent Bit is collecting:
- Application logs from your containers
- Dataplane logs from services like kubelet and containerd
- Host-level logs from system files such as
/var/log/messagesand/var/log/secure
This setup gives you a working solution to send and manage logs from any Kubernetes cluster, whether it's running inside AWS or elsewhere. You can filter logs by namespace, label, or file path, and forward them to CloudWatch for storage and review.
Need help with setting up an observability strategy for your business that scales? KubeNine can help. Reach out to us on contact@kubenine.com!


