
On this page
EC2 Memory Not Showing? Fix It with CloudWatch Agent (Terraform Setup)
If you can’t see EC2 memory usage in CloudWatch, you’re not alone. Here’s how to fix missing RAM metrics and avoid performance issues.

Introduction
AWS EC2 instances provide CPU and network metrics by default — but memory usage is missing.
This becomes a major problem during production incidents because high RAM usage can crash applications without warning.
In this guide, you’ll learn how to monitor EC2 memory usage using CloudWatch Agent, custom metrics, and Terraform alarms.
Step 1: Configure a Systems Manager Parameter
- Open the Systems Manager service in the AWS Console.
- Go to Parameter Store and click Create Parameter.
- Fill in these details:
- Name:
/alarm/AWS-CWAgentLinConfig - Type: String
- Value: Paste the JSON configuration below:
- Name:
{
    "metrics": {
        "append_dimensions": {
            "InstanceId": "${aws:InstanceId}"
        },
        "metrics_collected": {
            "mem": {
                "measurement": [
                    "mem_used_percent"
                ],
                "metrics_collection_interval": 60
            }
        }
    }
}
This configuration tells the CloudWatch Agent to monitor memory usage and report the percentage of memory used every 60 seconds.
Step 2: Create an IAM Role with a Custom Policy
Go to the IAM service in the AWS Console.
- Click Roles → Create Role → Select EC2 as the trusted entity.
- Create a custom policy with the following JSON:
{
    "Version": "2012-10-17",
    "Statement": [
        {
            "Sid": "CWACloudWatchServerPermissions",
            "Effect": "Allow",
            "Action": [
                "cloudwatch:PutMetricData",
                "ec2:DescribeVolumes",
                "ec2:DescribeTags",
                "logs:PutLogEvents",
                "logs:PutRetentionPolicy",
                "logs:DescribeLogStreams",
                "logs:DescribeLogGroups",
                "logs:CreateLogStream",
                "logs:CreateLogGroup"
            ],
            "Resource": "*"
        },
        {
            "Sid": "CWASSMServerPermissions",
            "Effect": "Allow",
            "Action": [
                "ssm:GetParameter"
            ],
            "Resource": "arn:aws:ssm:REGION:ACCOUNT_ID:parameter/alarm/AWS-CWAgentLinConfig"
        }
    ]
}
- Replace
REGIONwith your AWS region (e.g.,us-east-1). - Replace
ACCOUNT_IDwith your AWS account ID.
- Attach this policy to the role and name it:
EC2-Custom-CloudWatch-Role.
Step 3: Launch an EC2 Instance
- Go to the EC2 service in the AWS Console.
- Launch a new EC2 instance.
- During the setup:
- Attach the role created in Step 2 (
EC2-Custom-CloudWatch-Role). - Add the following User Data script:
- Attach the role created in Step 2 (
#!/bin/bash
wget https://s3.amazonaws.com/amazoncloudwatch-agent/linux/amd64/latest/AmazonCloudWatchAgent.zip
unzip AmazonCloudWatchAgent.zip
chmod +x ./install.sh
sudo ./install.sh
sudo /opt/aws/amazon-cloudwatch-agent/bin/amazon-cloudwatch-agent-ctl -a fetch-config -m ec2 -c ssm:/alarm/AWS-CWAgentLinConfig -s
This installs and configures the CloudWatch Agent on the instance.
Step 4: Verify CloudWatch Agent Installation
- After the instance launches, connect to it using SSH.
- Run this command to check the agent's status:
sudo /opt/aws/amazon-cloudwatch-agent/bin/amazon-cloudwatch-agent-ctl -m ec2 -a status- If the agent is running, memory metrics will be sent to CloudWatch.
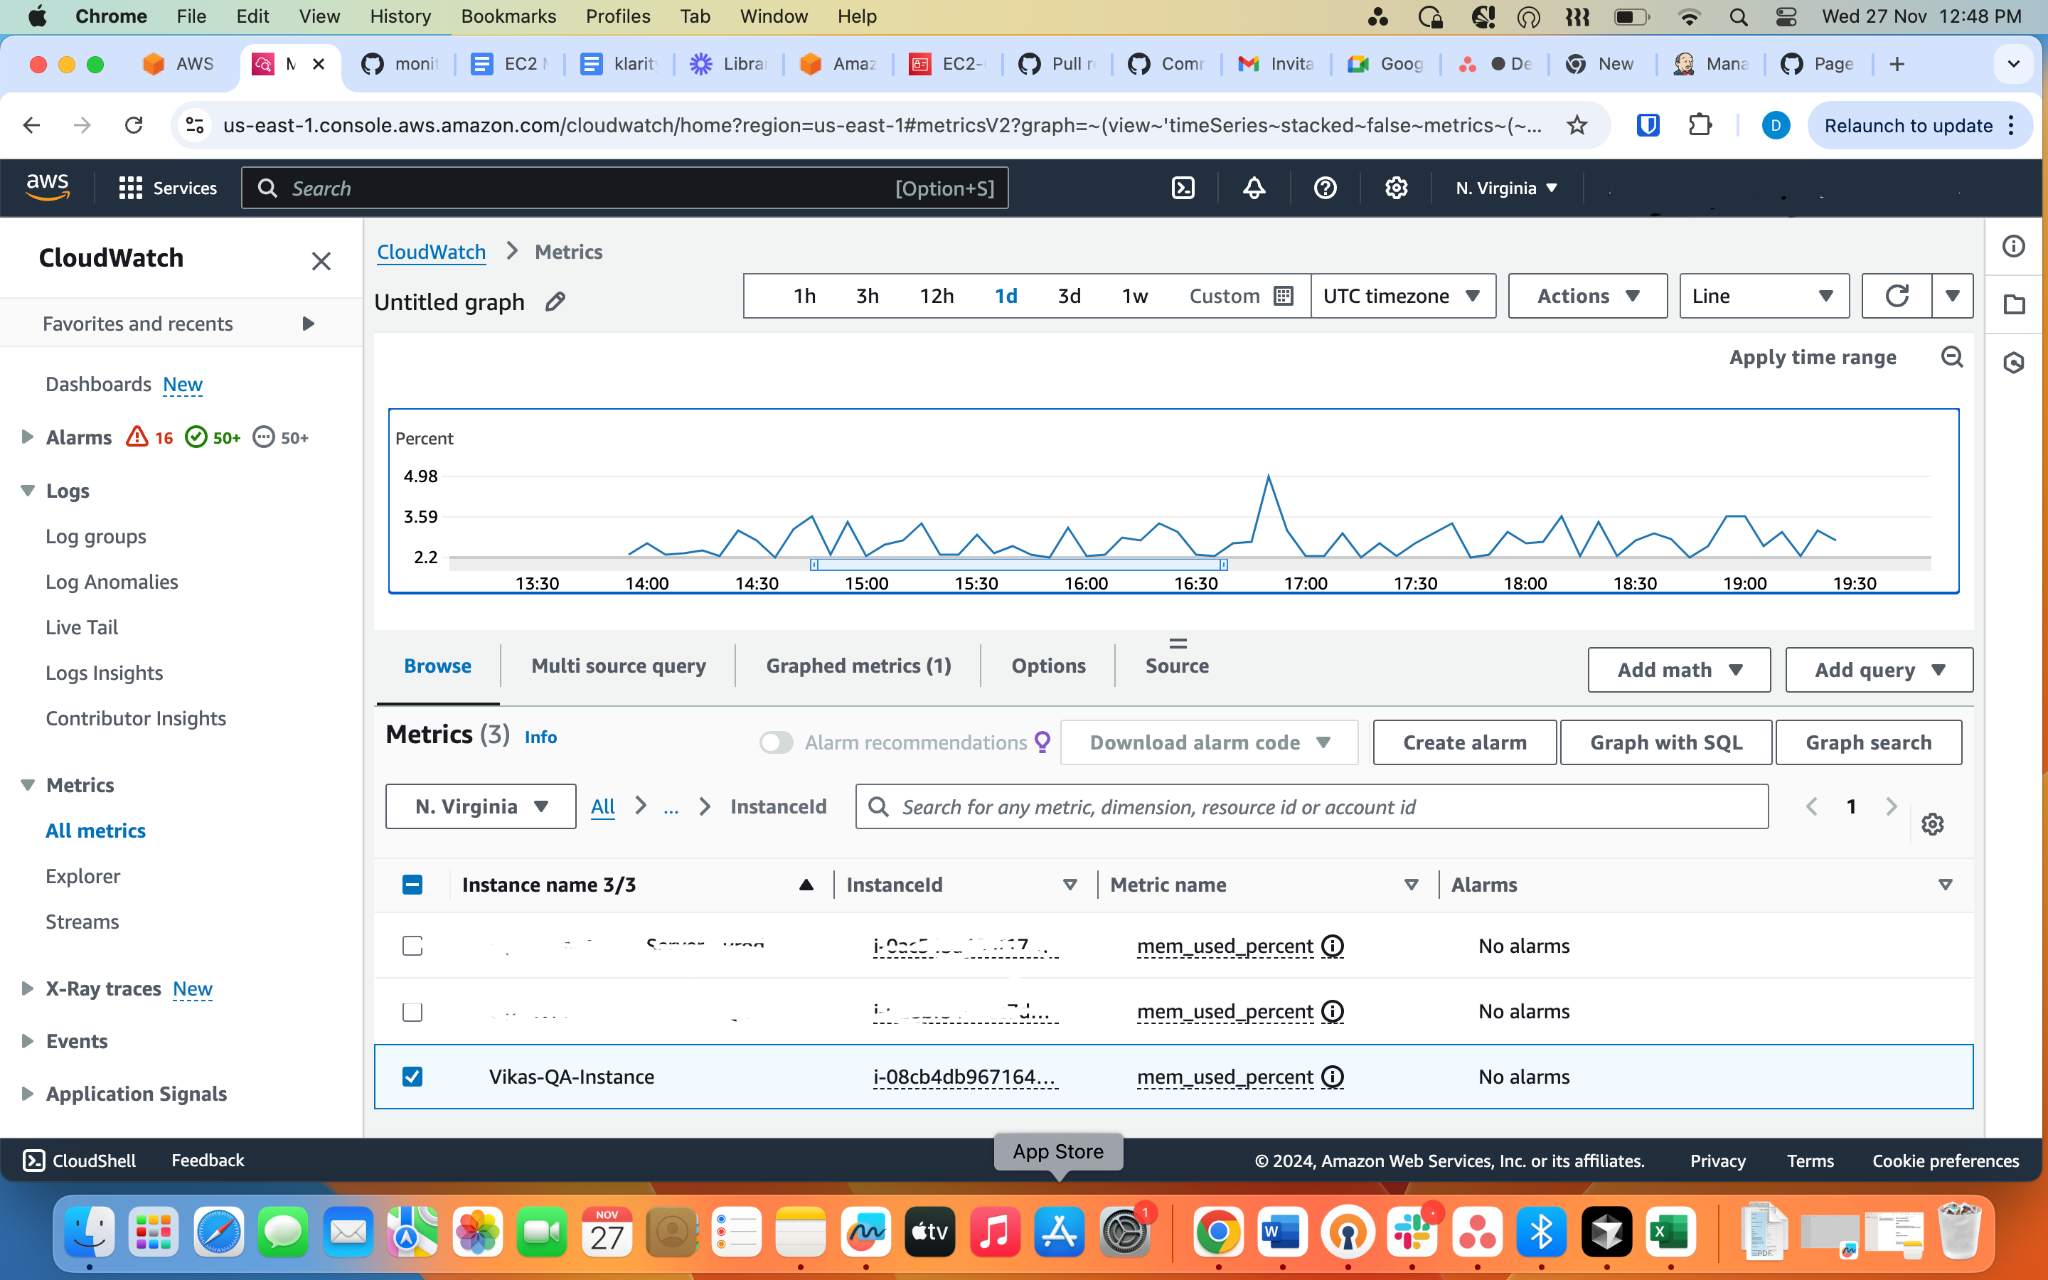
Step 5: Visualize Metrics and Set Up an Alarm
- Open the CloudWatch service in the AWS Console.
- Navigate to Metrics and search for metrics under the CWAgent namespace.
- Locate your EC2 instance by its InstanceId.
- Select the
mem_used_percentmetric to view memory usage.
- Now we use Terraform for automating CloudWatch alarms and a CI/CD pipeline to maintain dynamic scalability.
Step 6: Create an alarm and CI/CD pipeline
- alarm.tf
module "notify_slack" {
  source             = "terraform-aws-modules/notify-slack/aws"
  version            = "~> 5.0"
  sns_topic_name     = var.sns_topic_name
  slack_webhook_url  = var.slack_webhook_url
  slack_channel      = var.slack_channel
  slack_username     = var.slack_username
}


# CPU Alarm
resource "aws_cloudwatch_metric_alarm" "cpu_alarm" {
  for_each            = toset(local.instance_ids)
  alarm_name          = "HighCPU-${each.key}"
  comparison_operator = "GreaterThanThreshold"
  evaluation_periods  = 1
  metric_name         = "CPUUtilization"
  namespace           = "AWS/EC2"
  period              = var.cpu_period
  statistic           = "Average"
  threshold           = var.cpu_threshold
  alarm_description   = "Triggers when CPU exceeds ${var.cpu_threshold}% for instance ${each.key}."
  dimensions = {
    InstanceId = each.key
  }

   alarm_actions = [
    module.notify_slack.slack_topic_arn  # Slack notification topic
  ]

  ok_actions = [
    module.notify_slack.slack_topic_arn  # Slack notification when alarm recovers
  ]
}

# Memory Alarm
resource "aws_cloudwatch_metric_alarm" "memory_alarm" {
  for_each            = toset(local.instance_ids)
  alarm_name          = "HighMemory-${each.key}"
  comparison_operator = "GreaterThanThreshold"
  evaluation_periods  = 1
  metric_name         = "me"
  namespace           = "CWAgent"
  period              = var.memory_period
  statistic           = "Average"
  threshold           = var.memory_threshold
  alarm_description   = "Triggers when Memory exceeds ${var.memory_threshold}% for instance ${each.key}."
  dimensions = {
    InstanceId = each.key
  }
   alarm_actions = [
    module.notify_slack.slack_topic_arn  # Slack notification topic
  ]

  ok_actions = [
    module.notify_slack.slack_topic_arn  # Slack notification when alarm recovers
  ]
}- Data.tf
# Fetch instances dynamically using the specified filter if use_filter is true
data "aws_instances" "filtered_instances" {
  count = var.use_filter ? 1 : 0

  filter {
    name   = var.filter.name
    values = var.filter.values
  }
}

# Fetch instances by manually provided names if use_filter is false
data "aws_instance" "named_instances" {
  count  = var.use_filter ? 0 : length(var.instance_names)
  filter {
    name   = "tag:Name"
    values = [element(var.instance_names, count.index)]
  }
}

# Local variable to consolidate instance IDs based on the selection method
locals {
  instance_ids = (
    var.use_filter && length(data.aws_instances.filtered_instances) > 0
  ) ? data.aws_instances.filtered_instances[0].ids : [
    for instance in data.aws_instance.named_instances : instance.id
  ]
}
- variable.tf
#instance selection variables
variable "use_filter" {
  type        = bool
  default     = true
  description = "Set to true to use filtering; false to use specific instance names."
}

variable "filter" {
  type = object({
    name   = string
    values = list(string)
  })
  default = {
    name   = "tag:env"
    values = ["prod"]
  }
  description = "Filter criteria for selecting instances dynamically."
}

variable "instance_names" {
  type        = list(string)
  default     = ["prod1", "prod2", "prod3", "prod4"]
  description = "List of instance names (used if `use_filter` is false)."
}

variable "cpu_threshold" {
  type        = number
  default     = 85
  description = "CPU utilization percentage to trigger the alarm."
}

variable "memory_threshold" {
  type        = number
  default     = 85
  description = "Memory utilization percentage to trigger the alarm."
}


#slack notification variables
variable "sns_topic_name" {
  type        = string
  description = "Name of the SNS topic to be used for notifications."
}

variable "slack_webhook_url" {
  type        = string
  description = "URL of the Slack webhook for notifications."
}

variable "slack_channel" {
  type        = string
  description = "Name of the Slack channel for notifications."
}

variable "slack_username" {
  type        = string
  description = "Username for notifications."
}


#region variable
variable "region" {
  type        = string
  description = "Region for the resources."
}


#cloudwatch alarm variables
variable "cpu_period" {
  type        = number
  description = "Period for the CPU alarm."
}

variable "memory_period" {
  type        = number
  description = "Period for the memory alarm."
}
- terraform.tfvars for reference
#sns topic
region = "us-east-1"
sns_topic_name = "s3-monitor-slack"
slack_webhook_url = "https://hooks.slack.com/services/T0ggergeterterferfGlCvhkTYOdBVD"
slack_channel     = "a-notifications"
slack_username    = "reporter"


#cloudwatch alarm

cpu_threshold = 85       #cpu threshold
memory_threshold = 85    #memory threshold
cpu_period = 300         #cpu period in seconds
memory_period = 300      #memory period in seconds


#variables for instance selection
use_filter = true   #use true to filter instances by tag, false to use specific instance names


#filter for instance selection
filter = {
  name = "tag:env"
  values = ["prod"]
}

#list of instance names to monitor if use_filter is false
instance_names = ["kubenine-prod1", "kubenine-prod2"]- Use the following GitHub Actions workflow to Terraform updates are applied automatically when new EC2 instances are added:
name: 'Terraform EC2 Alarms CI/CD'

on:
  push:
    branches: [ "dev" ]
    paths:
      - ec2-alarms/**
  pull_request:
    branches: [ "dev" ]
    paths:
      - ec2-alarms/**

permissions:
  contents: read

jobs:
  terraform:
    name: 'Terraform'
    runs-on: ubuntu-latest

    steps:
    # Checkout the repository to the GitHub Actions runner
    - name: Checkout
      uses: actions/checkout@v3

    # Install the latest version of Terraform CLI and configure the Terraform CLI configuration file with a Terraform Cloud user API token
    - name: Set up Terraform
      uses: hashicorp/setup-terraform@v2
      with:
        terraform_version: 1.5.7

    - name: Configure AWS credentials
      uses: aws-actions/configure-aws-credentials@v2
      with:
        role-to-assume: arn:aws:iam::<account-id>:role/github-oidc-prod-qa-main
        aws-region: us-east-1 # Replace with your region

    - name: Terraform Init
      run: terraform init

    - name: Terraform Format
      run: terraform fmt

    - name: Terraform Plan
      run: terraform plan -no-color 2>&1 | tee ${{ github.workspace }}/plan_output.txt

    - name: Comment Terraform Plan on PR
      uses: blinqas/tf-plan-pr-comment@v1
      with:
        output_file: ${{ github.workspace }}/plan_output.txt
      env:
        GITHUB_TOKEN: ${{ secrets.GITHUB_TOKEN }}

    - name: Terraform Apply
      if: github.ref == 'refs/heads/dev' && github.event_name == 'push'
      run: terraform apply -auto-approve
FAQs
Why does EC2 not show memory usage by default?
AWS EC2 instances provide CPU and network metrics automatically, but memory usage is not available by default. To monitor RAM usage, you need to install the Amazon CloudWatch Agent.
How do I monitor EC2 memory usage in AWS?
You can monitor EC2 memory usage by installing the CloudWatch Agent on your instance and sending custom memory metrics to Amazon CloudWatch.
What is the Amazon CloudWatch Agent?
Amazon CloudWatch Agent is a monitoring tool that collects system-level metrics such as memory usage, disk usage, swap usage, and logs from EC2 instances.
Can I create CloudWatch alarms for EC2 memory usage?
Yes. Once memory metrics are available in CloudWatch, you can create CloudWatch alarms to notify your team when RAM usage crosses a threshold.
How do I verify if the CloudWatch Agent is running?
You can check the CloudWatch Agent status using:
sudo /opt/aws/amazon-cloudwatch-agent/bin/amazon-cloudwatch-agent-ctl -m ec2 -a statusConclusion
And there you have it! You’ve successfully set up memory monitoring for your EC2 instances using Amazon CloudWatch and a custom IAM policy. This setup helps you track memory usage, organize your monitoring, and avoid the hassle of manual configurations.
If you need expert help with monitoring or optimizing your cloud infrastructure, reach out to KubeNine. We provide end-to-end solutions so you can focus on your product while we handle the technical details.
By following these steps, you’ve taken a big step toward a smarter, more reliable cloud environment. Tracking memory metrics has never been easier!