
On this page
How to Create a Custom Healthy Backend Count Metric in GCP (Fixing the AWS HealthyHostCount Gap)

Introduction
Google Cloud Platform does not provide a direct equivalent to AWS's HealthyHostCount metric. While AWS offers a built-in metric showing how many targets in a target group are passing health checks, GCP's approach is fragmented across different load balancer types and backend configurations. The closest built-in metric, loadbalancing.googleapis.com/backend/healthy_instances, only works for instance groups and lacks universal availability across all backend types, especially for Network Endpoint Groups (NEGs) used with serverless backends.
This gap creates challenges when building consistent monitoring and alerting for load balancer health across different backend configurations. Without a unified metric, teams struggle to set up reliable alerts for backend health degradation, making it difficult to detect issues before they impact users.
This guide shows how to build a custom exporter that discovers all backend services in a GCP project, queries their health status through the Compute Engine API, and publishes a standardized healthy backend count metric to Cloud Monitoring. The solution works across instance groups and NEGs, providing the missing visibility needed for production-grade monitoring and alerting.
Architecture Overview
The solution uses a scheduled containerized exporter that periodically checks backend health and publishes metrics:
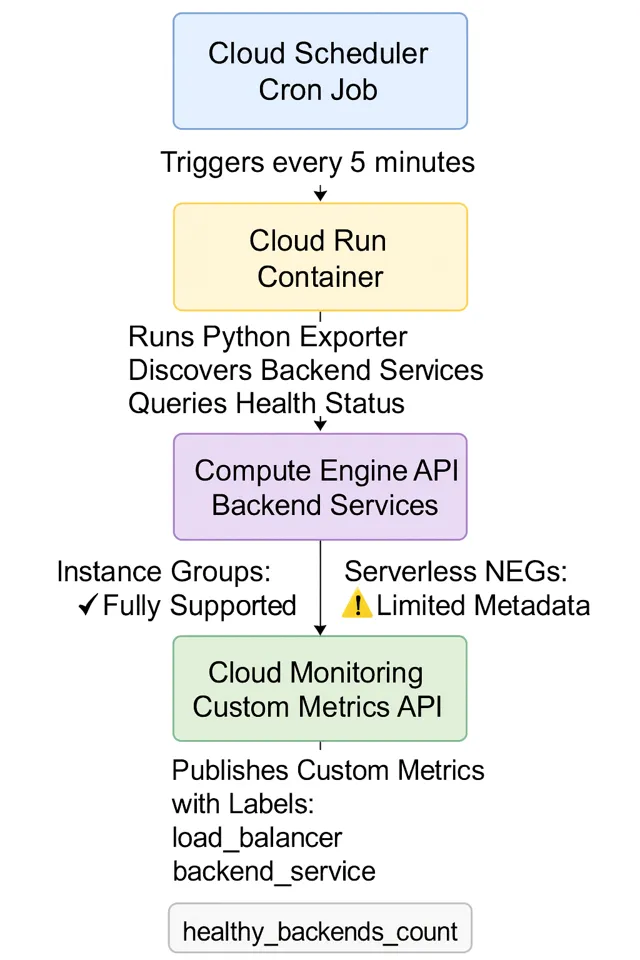
Cloud Scheduler triggers a Cloud Run container every 5 minutes. The Python exporter discovers all backend services, queries health status for each backend group or NEG, and publishes custom metrics to Cloud Monitoring with labels for load balancer, backend service, and backend type.
Step-by-Step Implementation
1. Understanding the Exporter Structure
The exporter consists of three main components: backend discovery, health checking, and metric publishing. The HealthyBackendExporter class orchestrates these operations:
class HealthyBackendExporter:
    def __init__(self, project_id: str, poll_interval: int = 60):
        self.project_id = project_id
        self.backend_services_client = compute_v1.BackendServicesClient()
        self.url_maps_client = compute_v1.UrlMapsClient()
        self.region_url_maps_client = compute_v1.RegionUrlMapsClient()
        self.monitoring_client = monitoring_v3.MetricServiceClient()
        self.metric_type_prefix = "custom.googleapis.com/lb"
        self.backend_to_lb_map: Dict[str, List[str]] = {}
The exporter maintains a mapping between backend services and load balancers (URL maps) to enrich metrics with load balancer context, making it easier to filter and alert on specific load balancers.
2. Building Backend to Load Balancer Mapping
Before checking health, the exporter builds a mapping of which backend services are used by which load balancers. This mapping comes from URL maps, which define routing rules:
def build_backend_to_lb_mapping(self) -> None:
    self.backend_to_lb_map = {}

    # Global URL maps
    url_maps = self.url_maps_client.list(
        request=compute_v1.ListUrlMapsRequest(project=self.project_id)
    )

    for url_map in url_maps:
        self._extract_backends_from_url_map(url_map)

    # Regional URL maps
    regional = self.region_url_maps_client.aggregated_list(
        request=compute_v1.AggregatedListRegionUrlMapsRequest(
            project=self.project_id
        )
    )
The _extract_backends_from_url_map method traverses default services, path matchers, and route rules to collect all backend service references, building a bidirectional mapping for metric labeling.
3. Discovering Backend Services
The exporter uses the aggregated list API to discover both global and regional backend services:
def discover_backend_services(self) -> List[Tuple[str, Optional[str]]]:
    agg = self.backend_services_client.aggregated_list(
        request=compute_v1.AggregatedListBackendServicesRequest(
            project=self.project_id
        )
    )

    for scope, response in agg:
        for bs in getattr(response, "backend_services", []) or []:
            region_name = None
            if scope and scope != "global":
                if "regions/" in scope:
                    region_name = scope.split("regions/")[-1]

            backend_services.append((bs.name, region_name))
This returns a list of tuples containing backend service names and their regions (None for global services). The region information is necessary because health checking requires different API calls for regional versus global backend services.
4. Querying Backend Health
The health checking logic handles both global and regional backend services, iterating through each backend group or NEG and querying health status:
@retry.Retry(predicate=retry.if_exception_type(Exception), deadline=30.0)
def get_backend_health(
    self, backend_service_name: str, region: Optional[str] = None
) -> Optional[BackendHealth]:
    if region:
        regional_client = compute_v1.RegionBackendServicesClient()
        bs = regional_client.get(...)
        health_client = regional_client
    else:
        bs = self.backend_services_client.get(...)
        health_client = self.backend_services_client

    healthy_count = 0
    total_count = 0

    for backend in getattr(bs, "backends", []) or []:
        group_url = getattr(backend, "group", None)

        # Determine backend type
        if "instanceGroups" in group_url:
            backend_type = "INSTANCE_GROUP"
        elif "networkEndpointGroups" in group_url:
            backend_type = "NETWORK_ENDPOINT_GROUP"

        # Query health for this backend group
        req = compute_v1.GetHealthBackendServiceRequest(
            project=self.project_id,
            backend_service=backend_service_name,
            resource_group_reference_resource=compute_v1.ResourceGroupReference(
                group=group_url
            ),
        )

        health_resp = health_client.get_health(request=req)

        for hs in getattr(health_resp, "health_status", []) or []:
            total_count += 1
            if "HEALTHY" in str(getattr(hs, "health_state", "")).upper():
                healthy_count += 1
The method uses retry logic to handle transient API failures and aggregates health status across all backend groups in a service. It identifies backend types by inspecting the group URL structure, which helps with filtering and alerting later.
5. Publishing Metrics to Cloud Monitoring
The exporter publishes metrics with labels for load balancer, backend service, and backend type:
def write_metric(self, bh: BackendHealth) -> bool:
    project_name = f"projects/{self.project_id}"
    now = time.time()
    seconds = int(now)
    nanos = int((now - seconds) * 1_000_000_000)

    series = []
    for lb_name in bh.load_balancers:
        series.append({
            "metric": {
                "type": f"{self.metric_type_prefix}/healthy_backends_count",
                "labels": {
                    "load_balancer": lb_name,
                    "backend_service": bh.backend_name,
                    "backend_type": bh.backend_type,
                },
            },
            "resource": {
                "type": "global",
                "labels": {"project_id": self.project_id},
            },
            "points": [{
                "interval": {
                    "end_time": {"seconds": seconds, "nanos": nanos}
                },
                "value": {"int64_value": bh.healthy_count},
            }],
        })

    self.monitoring_client.create_time_series(
        name=project_name, time_series=series
    )
The exporter creates one time series per load balancer that uses the backend service, allowing filtering by specific load balancers in dashboards and alerts. It also publishes a heartbeat metric indicating exporter execution status and the number of backends processed.
6. Deploying to Cloud Run
Package the exporter as a containerized application for Cloud Run. Create a Dockerfile:
FROM python:3.11-slim

WORKDIR /app

COPY requirements.txt .
RUN pip install --no-cache-dir -r requirements.txt

COPY exporter.py .

ENTRYPOINT ["python", "exporter.py"]
ENV PORT=8080
The requirements.txt should include:
google-cloud-compute>=1.14.0
google-cloud-monitoring>=2.15.0
flask>=2.3.0
Build and deploy to Cloud Run:
docker build -t gcr.io/PROJECT_ID/healthy-backend-exporter .
docker push gcr.io/PROJECT_ID/healthy-backend-exporter

gcloud run deploy healthy-backend-exporter \
  --image gcr.io/PROJECT_ID/healthy-backend-exporter \
  --platform managed \
  --region us-central1 \
  --set-env-vars GCP_PROJECT_ID=PROJECT_ID \
  --set-env-vars RUN_MODE=http \
  --service-account exporter-sa@PROJECT_ID.iam.gserviceaccount.com
The service account needs these IAM roles:
roles/compute.viewer- to list and read backend servicesroles/monitoring.metricWriter- to publish custom metrics
7. Setting Up Cloud Scheduler
Create a Cloud Scheduler job to trigger the exporter every 5 minutes:
gcloud scheduler jobs create http healthy-backend-exporter-job \
  --schedule="*/5 * * * *" \
  --uri="https://REGION-PROJECT_ID.cloudfunctions.net/healthy-backend-exporter" \
  --http-method=POST \
  --oidc-service-account-email=exporter-sa@PROJECT_ID.iam.gserviceaccount.com \
  --oidc-token-audience=https://REGION-PROJECT_ID.cloudfunctions.net/healthy-backend-exporter
For Cloud Run, use the Cloud Run service URL. The exporter handles HTTP GET or POST requests from Cloud Scheduler:
gcloud scheduler jobs create http healthy-backend-exporter-job \
  --schedule="*/5 * * * *" \
  --uri="https://healthy-backend-exporter-REGION-PROJECT_ID.a.run.app" \
  --http-method=GET \
  --oidc-service-account-email=exporter-sa@PROJECT_ID.iam.gserviceaccount.com \
  --oidc-token-audience=https://healthy-backend-exporter-REGION-PROJECT_ID.a.run.app
When Cloud Scheduler triggers the service, the Flask app receives the HTTP request, runs the export cycle, and returns a JSON response indicating success or failure. The exporter logs all metrics published during the run.
The 5-minute interval balances freshness with API quota usage. Adjust based on your alerting requirements and backend service count.
8. Creating Alerts on Custom Metrics
Once metrics are flowing, create alerting policies in Cloud Monitoring. Filter by healthy_backends_count equal to 0 and filter by backend_service label to target specific services. You can create these alerts using Terraform, gcloud CLI, or the Cloud Console.
Handling Edge Cases
The exporter includes error handling for common scenarios:
- Missing backend groups: Skips backends without group URLs
- API failures: Uses retry logic with 30-second deadline
- Regional vs global: Handles both service types correctly
- NEG limitations: Logs warnings when health checks fail for NEGs (some serverless NEGs have limited health check support)
- Unmapped backends: Uses "unknown" as load balancer label when backend isn't found in URL maps
The exporter logs warnings for unhealthy backends and errors for failed health checks, making debugging straightforward through Cloud Run logs.
Monitoring the Exporter
The exporter publishes a heartbeat metric custom.googleapis.com/lb/exporter_success that indicates whether each run succeeded and how many backends were processed. Monitor this metric to detect exporter failures:
fetch global
| metric 'custom.googleapis.com/lb/exporter_success'
| filter metric.status == 'failure'
| group_by 5m
Set up an alert on exporter failures to ensure the monitoring system itself is functioning correctly.
Complete Exporter Code
The complete exporter code with HTTP request handling for Cloud Scheduler triggers:
#!/usr/bin/env python3
"""
GCP Healthy Backend Count Exporter (Cloud Monitoring)
Discovers backend services in a GCP project and publishes a custom metric
representing the number of healthy backends behind each service.
Metric written:
- custom.googleapis.com/lb/healthy_backends_count
Labels: load_balancer, backend_service, backend_type
This is useful for alerting on load balancer / backend health at scale.
"""
import os
import sys
import time
import logging
from typing import Dict, List, Tuple, Optional
from dataclasses import dataclass
from google.cloud import compute_v1
from google.cloud import monitoring_v3
from google.api_core import retry
from flask import Flask, request
# -------------------------------------------------------------------
# Logging
# -------------------------------------------------------------------
logging.basicConfig(
level=logging.INFO,
format="%(asctime)s - %(name)s - %(levelname)s - %(message)s",
)
logger = logging.getLogger("healthy-backend-exporter")
# -------------------------------------------------------------------
# Flask app for Cloud Scheduler HTTP triggers
# -------------------------------------------------------------------
app = Flask(__name__)
# -------------------------------------------------------------------
# Data model
# -------------------------------------------------------------------
@dataclass
class BackendHealth:
backend_name: str
healthy_count: int
total_count: int
unhealthy_backends: List[str]
backend_type: str # INSTANCE_GROUP | NETWORK_ENDPOINT_GROUP | UNKNOWN
load_balancers: List[str] # URL-map names using this backend
# -------------------------------------------------------------------
# Exporter
# -------------------------------------------------------------------
class HealthyBackendExporter:
"""
Exports healthy backend counts to Cloud Monitoring custom metrics.
"""
def __init__(self, project_id: str, poll_interval: int = 60):
self.project_id = project_id
self.poll_interval = poll_interval
# GCP clients
self.backend_services_client = compute_v1.BackendServicesClient()
self.url_maps_client = compute_v1.UrlMapsClient()
self.region_url_maps_client = compute_v1.RegionUrlMapsClient()
self.monitoring_client = monitoring_v3.MetricServiceClient()
self.metric_type_prefix = "custom.googleapis.com/lb"
self.backend_to_lb_map: Dict[str, List[str]] = {}
logger.info("Exporter initialized for project %s", project_id)
# ----------------------------------------------------------------
# Mapping: backend service -> load balancer (URL map)
# ----------------------------------------------------------------
def build_backend_to_lb_mapping(self) -> None:
"""
Build a mapping of backend services to URL maps (load balancers).
Used only to label metrics with LB names for easier filtering.
"""
logger.info("Building backend->load balancer mapping...")
self.backend_to_lb_map = {}
try:
# Global URL maps
url_maps = self.url_maps_client.list(
request=compute_v1.ListUrlMapsRequest(project=self.project_id)
)
for url_map in url_maps:
self._extract_backends_from_url_map(url_map)
# Regional URL maps (aggregated)
regional = self.region_url_maps_client.aggregated_list(
request=compute_v1.AggregatedListRegionUrlMapsRequest(
project=self.project_id
)
)
for _, response in regional:
for url_map in getattr(response, "url_maps", []) or []:
self._extract_backends_from_url_map(url_map)
logger.info("Mapped %d backend services to LBs", len(self.backend_to_lb_map))
except Exception as e:
logger.warning("Failed building backend->LB mapping: %s", e)
def _extract_backends_from_url_map(self, url_map) -> None:
lb_name = url_map.name
def add_backend(service_url: str):
if not service_url:
return
backend_name = service_url.split("/")[-1]
self.backend_to_lb_map.setdefault(backend_name, [])
if lb_name not in self.backend_to_lb_map[backend_name]:
self.backend_to_lb_map[backend_name].append(lb_name)
add_backend(getattr(url_map, "default_service", None))
for pm in getattr(url_map, "path_matchers", []) or []:
add_backend(getattr(pm, "default_service", None))
for rr in getattr(pm, "route_rules", []) or []:
add_backend(getattr(rr, "service", None))
# ----------------------------------------------------------------
# Discover backend services
# ----------------------------------------------------------------
def discover_backend_services(self) -> List[Tuple[str, Optional[str]]]:
"""
Returns list of (backend_service_name, region).
region=None => global backend service.
"""
logger.info("Discovering backend services...")
backend_services: List[Tuple[str, Optional[str]]] = []
try:
agg = self.backend_services_client.aggregated_list(
request=compute_v1.AggregatedListBackendServicesRequest(
project=self.project_id
)
)
for scope, response in agg:
for bs in getattr(response, "backend_services", []) or []:
region_name = None
if scope and scope != "global":
if "regions/" in scope:
region_name = scope.split("regions/")[-1]
elif scope.startswith("regions/"):
region_name = scope.replace("regions/", "")
backend_services.append((bs.name, region_name))
logger.info(
"Found backend service: %s (region: %s)",
bs.name,
region_name or "global",
)
logger.info("Discovered %d backend services", len(backend_services))
return backend_services
except Exception as e:
logger.error("Error discovering backend services: %s", e)
return []
# ----------------------------------------------------------------
# Health lookup
# ----------------------------------------------------------------
@retry.Retry(predicate=retry.if_exception_type(Exception), deadline=30.0)
def get_backend_health(
self, backend_service_name: str, region: Optional[str] = None
) -> Optional[BackendHealth]:
"""
Query getHealth() for each backend group/NEG in the service,
count HEALTHY vs total endpoints/instances.
"""
try:
if region:
regional_client = compute_v1.RegionBackendServicesClient()
bs = regional_client.get(
request=compute_v1.GetRegionBackendServiceRequest(
project=self.project_id,
region=region,
backend_service=backend_service_name,
)
)
health_client = regional_client
is_regional = True
else:
bs = self.backend_services_client.get(
request=compute_v1.GetBackendServiceRequest(
project=self.project_id,
backend_service=backend_service_name,
)
)
health_client = self.backend_services_client
is_regional = False
healthy_count = 0
total_count = 0
unhealthy_backends: List[str] = []
backend_type = "UNKNOWN"
for backend in getattr(bs, "backends", []) or []:
group_url = getattr(backend, "group", None)
if not group_url:
continue
# Decide backend type based on URL
if "instanceGroups" in group_url:
backend_type = "INSTANCE_GROUP"
elif "networkEndpointGroups" in group_url:
backend_type = "NETWORK_ENDPOINT_GROUP"
else:
backend_type = "UNKNOWN"
try:
if is_regional:
req = compute_v1.GetHealthRegionBackendServiceRequest(
project=self.project_id,
region=region,
backend_service=backend_service_name,
resource_group_reference_resource=compute_v1.ResourceGroupReference(
group=group_url
),
)
else:
req = compute_v1.GetHealthBackendServiceRequest(
project=self.project_id,
backend_service=backend_service_name,
resource_group_reference_resource=compute_v1.ResourceGroupReference(
group=group_url
),
)
health_resp = health_client.get_health(request=req)
for hs in getattr(health_resp, "health_status", []) or []:
total_count += 1
state = str(getattr(hs, "health_state", "UNKNOWN"))
if "HEALTHY" in state.upper():
healthy_count += 1
else:
inst = getattr(hs, "instance", None)
inst_name = inst.split("/")[-1] if inst else "unknown"
unhealthy_backends.append(f"{inst_name}:{state}")
except Exception as e:
logger.warning("Could not get health for %s: %s", group_url, e)
load_balancers = self.backend_to_lb_map.get(
backend_service_name, ["unknown"]
)
bh = BackendHealth(
backend_name=backend_service_name,
healthy_count=healthy_count,
total_count=total_count,
unhealthy_backends=unhealthy_backends,
backend_type=backend_type,
load_balancers=load_balancers,
)
logger.info(
"Backend %s | healthy %d/%d | type %s | LBs %s",
backend_service_name,
healthy_count,
total_count,
backend_type,
", ".join(load_balancers),
)
if unhealthy_backends:
logger.warning(
"Unhealthy in %s: %s",
backend_service_name,
", ".join(unhealthy_backends),
)
return bh
except Exception as e:
logger.error("Error getting health for %s: %s", backend_service_name, e)
return None
# ----------------------------------------------------------------
# Metric publishing
# ----------------------------------------------------------------
def write_metric(self, bh: BackendHealth) -> bool:
"""
Creates one time series per load balancer name for this backend.
"""
try:
project_name = f"projects/{self.project_id}"
now = time.time()
seconds = int(now)
nanos = int((now - seconds) * 1_000_000_000)
series = []
for lb_name in bh.load_balancers:
series.append(
{
"metric": {
"type": f"{self.metric_type_prefix}/healthy_backends_count",
"labels": {
"load_balancer": lb_name,
"backend_service": bh.backend_name,
"backend_type": bh.backend_type,
},
},
"resource": {
"type": "global",
"labels": {"project_id": self.project_id},
},
"points": [
{
"interval": {
"end_time": {
"seconds": seconds,
"nanos": nanos,
}
},
"value": {"int64_value": bh.healthy_count},
}
],
}
)
if series:
self.monitoring_client.create_time_series(
name=project_name, time_series=series
)
pct = (
(bh.healthy_count / bh.total_count) * 100
if bh.total_count
else 0.0
)
logger.info(
"Metric written: %s healthy=%d total=%d (%.1f%%) LBs=%s",
bh.backend_name,
bh.healthy_count,
bh.total_count,
pct,
",".join(bh.load_balancers),
)
return True
except Exception as e:
logger.error("Error writing metric for %s: %s", bh.backend_name, e)
return False
def write_exporter_success_metric(self, success: bool, backend_count: int) -> None:
"""
Writes a simple heartbeat metric indicating the exporter ran.
Value is number of backends processed.
"""
try:
project_name = f"projects/{self.project_id}"
now = time.time()
seconds = int(now)
nanos = int((now - seconds) * 1_000_000_000)
ts = {
"metric": {
"type": f"{self.metric_type_prefix}/exporter_success",
"labels": {"status": "success" if success else "failure"},
},
"resource": {
"type": "global",
"labels": {"project_id": self.project_id},
},
"points": [
{
"interval": {
"end_time": {"seconds": seconds, "nanos": nanos}
},
"value": {"int64_value": backend_count},
}
],
}
self.monitoring_client.create_time_series(
name=project_name, time_series=[ts]
)
logger.info("Exporter heartbeat written (%s)", "success" if success else "failure")
except Exception as e:
logger.error("Error writing exporter heartbeat: %s", e)
# ----------------------------------------------------------------
# Run modes
# ----------------------------------------------------------------
def run_once(self) -> bool:
logger.info("Starting export cycle...")
start = time.time()
try:
self.build_backend_to_lb_mapping()
backend_services = self.discover_backend_services()
if not backend_services:
logger.warning("No backend services found")
self.write_exporter_success_metric(True, 0)
return True
success_count = 0
for name, region in backend_services:
bh = self.get_backend_health(name, region)
if bh and self.write_metric(bh):
success_count += 1
self.write_exporter_success_metric(True, len(backend_services))
elapsed = time.time() - start
logger.info(
"Export done in %.2fs | success %d/%d",
elapsed,
success_count,
len(backend_services),
)
return True
except Exception as e:
logger.error("Export cycle failed: %s", e)
self.write_exporter_success_metric(False, 0)
return False
def run_forever(self) -> None:
logger.info("Running continuously every %ds", self.poll_interval)
while True:
self.run_once()
time.sleep(self.poll_interval)
# -------------------------------------------------------------------
# Global exporter instance (initialized on first request)
# -------------------------------------------------------------------
_exporter: Optional[HealthyBackendExporter] = None
def get_exporter() -> HealthyBackendExporter:
global _exporter
if _exporter is None:
project_id = os.environ.get("GCP_PROJECT_ID")
if not project_id:
raise ValueError("GCP_PROJECT_ID environment variable is required")
_exporter = HealthyBackendExporter(project_id)
return _exporter
# -------------------------------------------------------------------
# Flask routes for Cloud Scheduler HTTP triggers
# -------------------------------------------------------------------
@app.route("/", methods=["GET", "POST"])
def health_check_export():
"""
Handles HTTP requests from Cloud Scheduler.
Runs the exporter and returns status.
"""
try:
exporter = get_exporter()
success = exporter.run_once()
if success:
return {"status": "success", "message": "Export completed"}, 200
else:
return {"status": "error", "message": "Export failed"}, 500
except Exception as e:
logger.error("Error handling request: %s", e)
return {"status": "error", "message": str(e)}, 500
@app.route("/health", methods=["GET"])
def health():
"""Health check endpoint for Cloud Run."""
return {"status": "healthy"}, 200
# -------------------------------------------------------------------
# Entrypoint
# -------------------------------------------------------------------
def main():
project_id = os.environ.get("GCP_PROJECT_ID")
poll_interval = int(os.environ.get("POLL_INTERVAL", "60"))
run_mode = os.environ.get("RUN_MODE", "http") # http | once | continuous
if not project_id:
logger.error("GCP_PROJECT_ID env var is required")
sys.exit(1)
if run_mode == "http":
# Run Flask app for Cloud Scheduler HTTP triggers
port = int(os.environ.get("PORT", 8080))
logger.info("Starting HTTP server on port %d", port)
app.run(host="0.0.0.0", port=port, debug=False)
else:
exporter = HealthyBackendExporter(project_id, poll_interval)
if run_mode == "continuous":
exporter.run_forever()
else:
ok = exporter.run_once()
sys.exit(0 if ok else 1)
if __name__ == "__main__":
main()The exporter includes HTTP request handling via Flask. When Cloud Scheduler sends an HTTP request to the Cloud Run service, the / route triggers the export cycle and returns a JSON response with the status. The /health endpoint provides a simple health check for Cloud Run's readiness probes.
Conclusion
This custom exporter fills the gap left by GCP's lack of a universal healthy backend count metric. By discovering backend services, querying health status through the Compute Engine API, and publishing standardized metrics to Cloud Monitoring, you gain consistent visibility across instance groups and NEGs.
The solution scales to hundreds of backend services, handles both global and regional configurations, and provides the foundation for reliable alerting on backend health degradation. The 5-minute polling interval balances freshness with API quota usage, while the heartbeat metric ensures the monitoring system itself remains observable.
From here, extend the exporter with additional metrics like healthy percentage, unhealthy backend details, or backend type-specific aggregations based on your alerting and dashboard requirements.
KubeNine Consulting specializes in GCP monitoring solutions and Kubernetes observability. Visit kubenine.com for expert guidance on production-ready monitoring implementations.