
Table of Contents
Introduction
AWS Cloudwatch is the default monitoring service on AWS. When you’re using AWS, Cloudwatch is part of the package - you’ll automatically get default metrics when you asked for them or not.
Things are good as long as you’re using these default metrics, but when you start to add your own custom metrics, that’s where we’ve seen organisations stumble. People often make common mistakes that lead to unexpected cost headaches.
In this blog, we’ll walk you through the common mistakes that most people make while implementing custom metrics and we’ll share some practical tips to help you get the most out of your Cloudwatch metrics without breaking the bank!
Unoptimized Data Retention
The Mistake
Keeping metrics at high resolutions longer than necessary or retaining data beyond its useful life can unnecessarily inflate storage costs.
The Solution
- Set Appropriate Retention Periods:
- 1-minute resolution: Retain for 15 days.
- 5-minute aggregation: Keep for 90 days.
- 1-hour aggregation: Store for 15 months.
- Implement Data Expiration: Automatically delete obsolete metrics to free up storage.
- Use Cleanup Scripts: Regularly run scripts to remove unused metrics, ensuring your storage remains efficient.
Misuse of High-Resolution Metrics
The Mistake
Enabling less than a minute resolution metrics without assessing the actual need.
Example: Enabling high-resolution metrics for all EC2 instances in your fleet, including development and staging environments where this level of granularity provides little value.
Solution
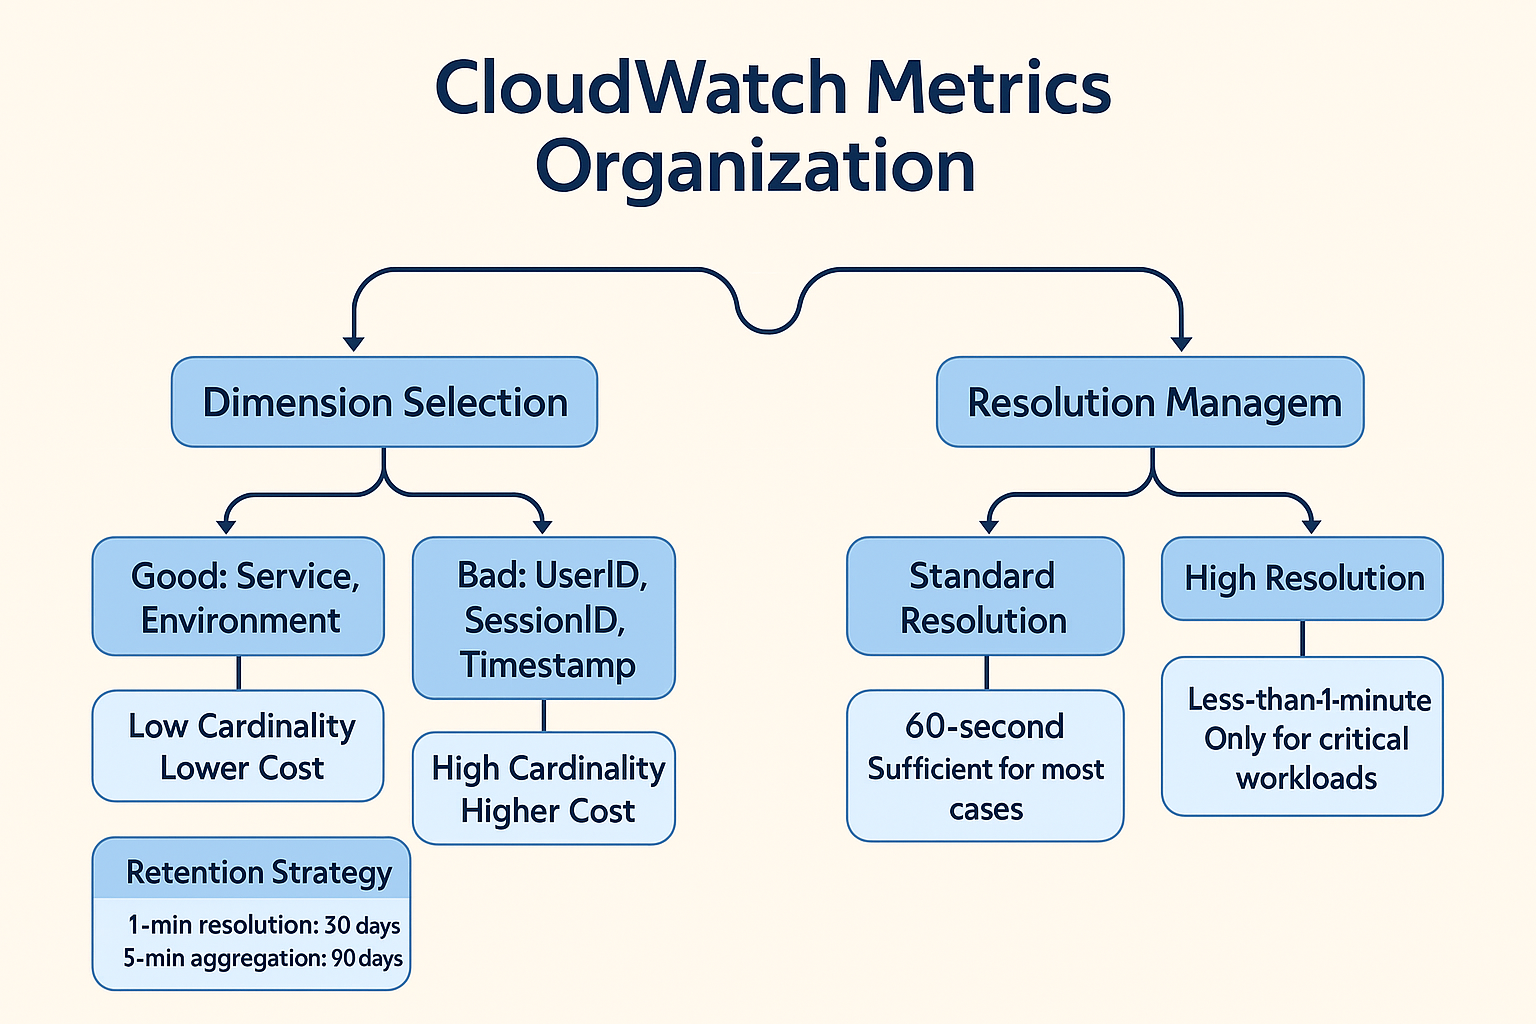
- Use High-Resolution Metrics Selectively: Reserve 1-second resolution for critical workloads where detailed monitoring is essential.
- Be Aware of Data Expiry: Understand that sub-minute data expires after 3 hours, so plan your data analysis accordingly.
- Utilize Metric Math: Instead of storing all raw high-frequency data, use metric math to derive insights, reducing storage needs.
- Default to Standard Resolution: For non-critical resources, a 60-second resolution is typically sufficient.
Poor Metric Organization and Dimensionality
The Mistake Throwing metrics into CloudWatch without a plan can lead to a billing diaster.
Real-world blunders I've seen:
- Adding user IDs as dimensions (like UserId=12345) in busy apps - suddenly you're tracking millions of unique metrics instead of useful aggregates.
- Adding timestamps as dimensions (RequestTime=2023-04-01T12:34:56Z)? You've just turned every single data point into its own metric.
- And don't get me started on using session IDs or request IDs as dimensions (SessionId=a1b2c3d4).
Here's the thing: CloudWatch bills you for each unique metric, and every combination of metric name plus dimension values counts separately.
Cost Calculation Example:
- Imagine an application with 50,000 active users per day
- If you track just 3 metrics (requests, latency, errors) with UserId as a dimension
- 50,000 users × 3 metrics = 150,000 unique metrics
- At $0.30 per metric per month, this would cost: 150,000 × $0.30 = $45,000 per month
- By comparison, using appropriate dimensions like service name and endpoint would result in perhaps 50 unique metrics, costing only $15 per month
Solution
- Keep your namespaces clean and logical: Group your metrics in intuitive namespaces like
AWS/EC2or create custom ones that make sense for your applications. - Choose dimensions that tell a story: Add meaningful context with dimensions like
InstanceIdorEnvironment=Productionso you can slice and dice your data in ways that actually help you. - Don't use unique IDs as dimensions: Trust me, you'll regret using user IDs or session IDs as dimensions when your metric count (and bill) explodes.
- Watch out for accidental metric duplication: Remember that CloudWatch treats metrics with the same dimensions but different units as separate metrics, so be careful not to double up unnecessarily.
Useful Scripts
Identify Metrics with High Cardinality
NOTE: If this script is taking more than a 2 minutes to run for you - then you might already be suffering from high cardinality.
import boto3
from collections import Counter
client = boto3.client('cloudwatch')
# Initialize variables
all_metrics = []
next_token = None
# Use pagination to get all metrics
while True:
    # If we have a next token, use it in the request
    if next_token:
        response = client.list_metrics(NextToken=next_token)
    else:
        response = client.list_metrics()
    # Add the metrics from this response to our collection
    all_metrics.extend(response['Metrics'])
    # Check if there are more metrics to fetch
    if 'NextToken' in response:
        next_token = response['NextToken']
    else:
        break
# Count metrics with the same name
metric_counter = Counter()
for metric in all_metrics:
    metric_counter[metric['MetricName']] += 1
# Display results
print("Metrics Count by Name:")
print("-" * 30)
for metric_name, count in metric_counter.most_common():
    print(f"{metric_name}: {count}")
print("\nTotal unique metric names:", len(metric_counter))
print("Total metrics:", sum(metric_counter.values()))
# Optional: Show some sample metrics with their dimensions
print("\nSample metrics with dimensions:")
print("-" * 30)
for i, metric in enumerate(response['Metrics'][:5]):  # Show first 5 metrics as samples
    print(f"Metric: {metric['MetricName']} (instance {i+1} of {metric_counter[metric['MetricName']]})")
    for dimension in metric['Dimensions']:
        print(f"  {dimension['Name']}: {dimension['Value']}")
Conclusion
Implementation Checklist
- Audit Existing Metrics: Identify and remove unnecessary metrics to streamline monitoring.
- Configure Retention Periods: Set data retention policies that align with your organization's needs and compliance requirements.
- Automate Cleanup Processes: Implement scripts to automatically delete obsolete metrics to free up storage.
- Default to Standard Resolution: For non-critical resources, a 60-second resolution is typically sufficient.
- Keep your namespaces clean and logical: Group your metrics in intuitive namespaces like
AWS/EC2or create custom ones that make sense for your applications. - Don't use unique IDs as dimensions:
Cloudwatch metrics are a powerful tool for monitoring your AWS resources. However, they can also be a source of unnecessary costs if not managed properly. By following the best practices outlined in this guide, you can optimize your CloudWatch metrics storage and reduce your AWS costs.
KubeNine can help you with this. We can help you audit your metrics, configure retention periods, automate cleanup processes, and more. Reach out to us to learn more.