
On this page
Why Your CloudWatch Bill Is So High (And How to Fix It)
Learn how to optimize AWS CloudWatch metrics to reduce costs and avoid high-cardinality mistakes. Discover best practices, real cost examples, and strategies to improve monitoring efficiency.

Introduction
A small mistake in CloudWatch metrics can cost you thousands of dollars every month — and most teams don’t even realize it.
This is one of the most common hidden AWS cost leaks in production systems.
AWS CloudWatch is a powerful monitoring tool, but without proper planning, it can quickly become an expensive liability. Many teams unknowingly store metrics inefficiently, leading to high costs and poor observability.
In this guide, you’ll learn CloudWatch metrics optimization techniques, common mistakes, and how to reduce AWS CloudWatch costs effectively.
Common CloudWatch Metrics Mistakes
1. Unoptimized Data Retention
The Problem
Keeping high-resolution metrics longer than necessary or retaining data beyond its useful life increases storage costs without adding value.
Most teams don’t realize this until they see a sudden spike in their AWS bill.
The Fix
- 1-minute resolution → retain for 15 days
- 5-minute aggregation → retain for 63 days
- 1-hour aggregation → retain for 15 months
Best Practices:
- Configure retention policies based on actual usage
- Automatically delete obsolete metrics
- Use cleanup scripts to manage storage efficiently
2. Misuse of High-Resolution Metrics
The Problem
Using sub-minute (high-resolution) metrics everywhere without evaluating actual need.
Example: Enabling 1-second metrics for all EC2 instances, including development and staging environments where this level of detail provides little value.
The Fix
- Use high-resolution metrics only for critical workloads
- Default to 60-second resolution for most use cases
- Remember: sub-minute data is stored only for 3 hours
- Use Metric Math instead of storing excessive raw data
3. Poor Metric Organization & High Cardinality
The Problem
Throwing metrics into CloudWatch without a structured plan leads to massive cost spikes.
I’ve seen teams accidentally create thousands of metrics without even noticing.
Common mistakes:
- Using
UserIdas a dimension - Adding timestamps as dimensions
- Using session or request IDs
High cardinality is the fastest way to accidentally create a massive AWS bill.
Each unique combination of metric name + dimensions = a new billable metric.
Real Cost Impact (Example)
Imagine:
- 50,000 active users per day
- 3 metrics (requests, latency, errors)
UserIdused as a dimension
Result:
50,000 × 3 = 150,000 metrics
Cost:
150,000 × $0.30 = $45,000/month
By comparison:
Using structured dimensions like Service and Environment may result in ~50 metrics only.
Cost → $15/month
This is the difference between smart metric design and poor planning.
CloudWatch Metrics Best Practices (Cost Optimization Guide)
Following these CloudWatch metrics best practices can significantly reduce AWS costs and improve monitoring efficiency.
- Keep namespaces clean and meaningful (e.g., AWS/EC2, App/Backend)
- Use low-cardinality dimensions such as:
- Service
- Environment
- InstanceId
- Avoid unique identifiers like UserId or SessionId
- Prevent duplicate metrics with different units
- Default to standard resolution unless absolutely necessary
Identify High Cardinality Metrics (Python Script)
Requirements:
- AWS CLI configured
- boto3 installed
import boto3
from collections import Counter

client = boto3.client('cloudwatch')

all_metrics = []
next_token = None

while True:
    if next_token:
        response = client.list_metrics(NextToken=next_token)
    else:
        response = client.list_metrics()

    all_metrics.extend(response['Metrics'])

    if 'NextToken' in response:
        next_token = response['NextToken']
    else:
        break

metric_counter = Counter()
for metric in all_metrics:
    metric_counter[metric['MetricName']] += 1

print("Metrics Count by Name:")
print("-" * 30)
for metric_name, count in metric_counter.most_common():
    print(f"{metric_name}: {count}")

print("\nTotal unique metric names:", len(metric_counter))
print("Total metrics:", sum(metric_counter.values()))
CloudWatch Metrics Architecture
Below is a simplified architecture showing how metric design impacts cost and performance:
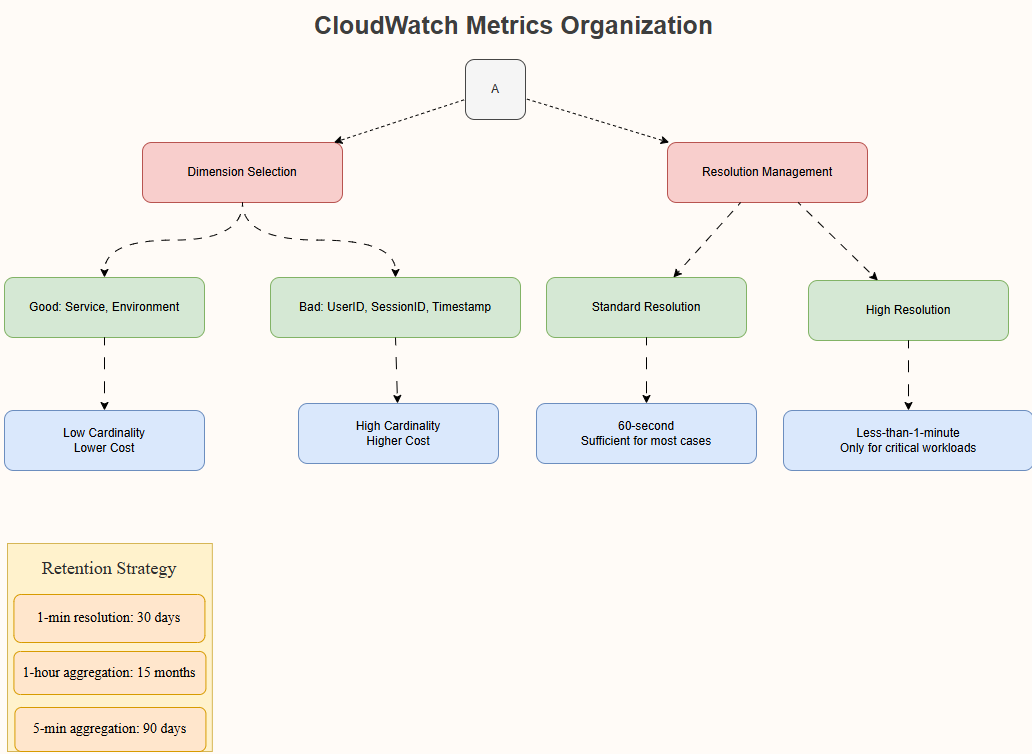
- Good vs bad dimension selection
- Impact of cardinality on cost
- Resolution strategy
- Retention optimization
Implementation Checklist
- Audit existing metrics and remove unnecessary ones
- Configure correct retention policies
- Avoid high-cardinality dimensions
- Default to standard resolution (60 seconds)
- Automate cleanup processes
- Organize namespaces logically
Read More on KubeBlogs
If you're exploring DevOps, Kubernetes, and cloud infrastructure, these guides will help you go deeper:
- How Kubernetes Routes Pod Traffic with a Single Egress IP
https://www.kubeblogs.com/how-civo-kubernetes-routes-pod-traffic-single-egress-ip-explained/ - GP3 vs GP2 EBS Volumes: Performance and Cost Comparison
https://www.kubeblogs.com/gp3-vs-gp2-ebs-volume-aws/ - How to Set Up a Self-Hosted GitHub Actions Runner
https://www.kubeblogs.com/self-hosted-github-actions-runner/
These articles cover Kubernetes networking, AWS storage optimization, and CI/CD infrastructure — useful when scaling beyond local development environments.
FAQs
What is CloudWatch metric cardinality?
Metric cardinality refers to the number of unique combinations of metric names and dimensions.
Why is high cardinality expensive?
Because AWS charges per unique metric, high-cardinality dimensions can rapidly increase monitoring costs.
What is CloudWatch default retention?
- 1-minute → 15 days
- 5-minute → 63 days
- 1-hour → 15 months
When should I use high-resolution metrics?
Only for critical workloads where detailed monitoring is required.
Conclusion
CloudWatch metrics are extremely powerful — but only when used correctly.
If you're not careful, CloudWatch metrics can silently become one of the most expensive parts of your AWS bill.
By applying the best practices in this guide, you can:
- Reduce AWS CloudWatch costs significantly
- Improve observability
- Build scalable monitoring systems
For more details, refer to AWS CloudWatch official documentation.
Need help optimizing your CloudWatch setup?
KubeNine can help you audit, optimize, and scale your monitoring strategy efficiently.