
On this page
All you need to know About Loki!

At KubeNine, we ensure that our customers log well and log right! Logs are crucial because they keep track of everything your applications do, from errors and warnings to user activities and system events. However, managing all these logs can take up a lot of resources and make it hard to stay on top of things.
For most developers, querying logs is just about string match or regex match, so why complicate it with advanced tools that use full-text search that have an overhead of a lot of indexing and distributed systems?
That’s where Loki comes in. Developed by Grafana Labs, Loki is a tool that simplifies log management and helps you avoid the usual headaches.
It’s designed to be easy to use and much more affordable compared to other tools. Loki helps you collect, organize, and search your logs without taking up a ton of resources or budget.
In this blog, we’ll walk you through what Loki is, how it works, and show you how to set it up in a straightforward way. Whether you’re new to logging or looking for a simpler solution, Loki might be just what you need to keep your logs in check.
What is Loki?
Loki is a log management tool developed by Grafana Labs. It helps you collect, store, and search through logs from your applications, but it does things a bit differently than traditional logging systems. Most log management tools, like Elasticsearch, index every piece of log data. This can get really heavy and expensive, especially when you have tons of logs coming in.
Loki, on the other hand, only indexes the labels (metadata) of your logs—things like the app name, environment, or other tags you use.
This means Loki doesn’t index the full content of the logs, which saves a lot of storage and makes it much more efficient.
Here’s a basic timeline of how Loki manages logs:
- Collecting Logs: Loki works with agents like Promtail, Fluentd, or Fluent Bit to gather logs from your applications. These agents send logs to Loki along with labels that describe the log source.
- Indexing Labels: Loki focuses on the labels you attach to your logs, instead of indexing the entire log content. This means that when you search for logs, you’re searching based on these labels (like “app=backend” or “env=production”).
- Storing Logs in Chunks: The actual log content (not indexed) is stored in compressed chunks. This keeps things lightweight and reduces the space Loki needs to store all your logs.
- Querying Logs: When you search through logs in Loki, you use the labels to find what you’re looking for. Loki fetches the compressed log data based on the labels, which keeps the searches fast and efficient.
By using this method, Loki is able to handle huge amounts of logs without eating up too many resources. It’s lightweight, efficient, and fits well into modern systems, especially if you’re already using tools like Prometheus or Grafana.
How Loki Works: A Simple Workflow
Writing Logs (Write Path)
Imagine we’re collecting logs from Promtail, an agent that gathers logs from your applications. This is how the flow will look like:
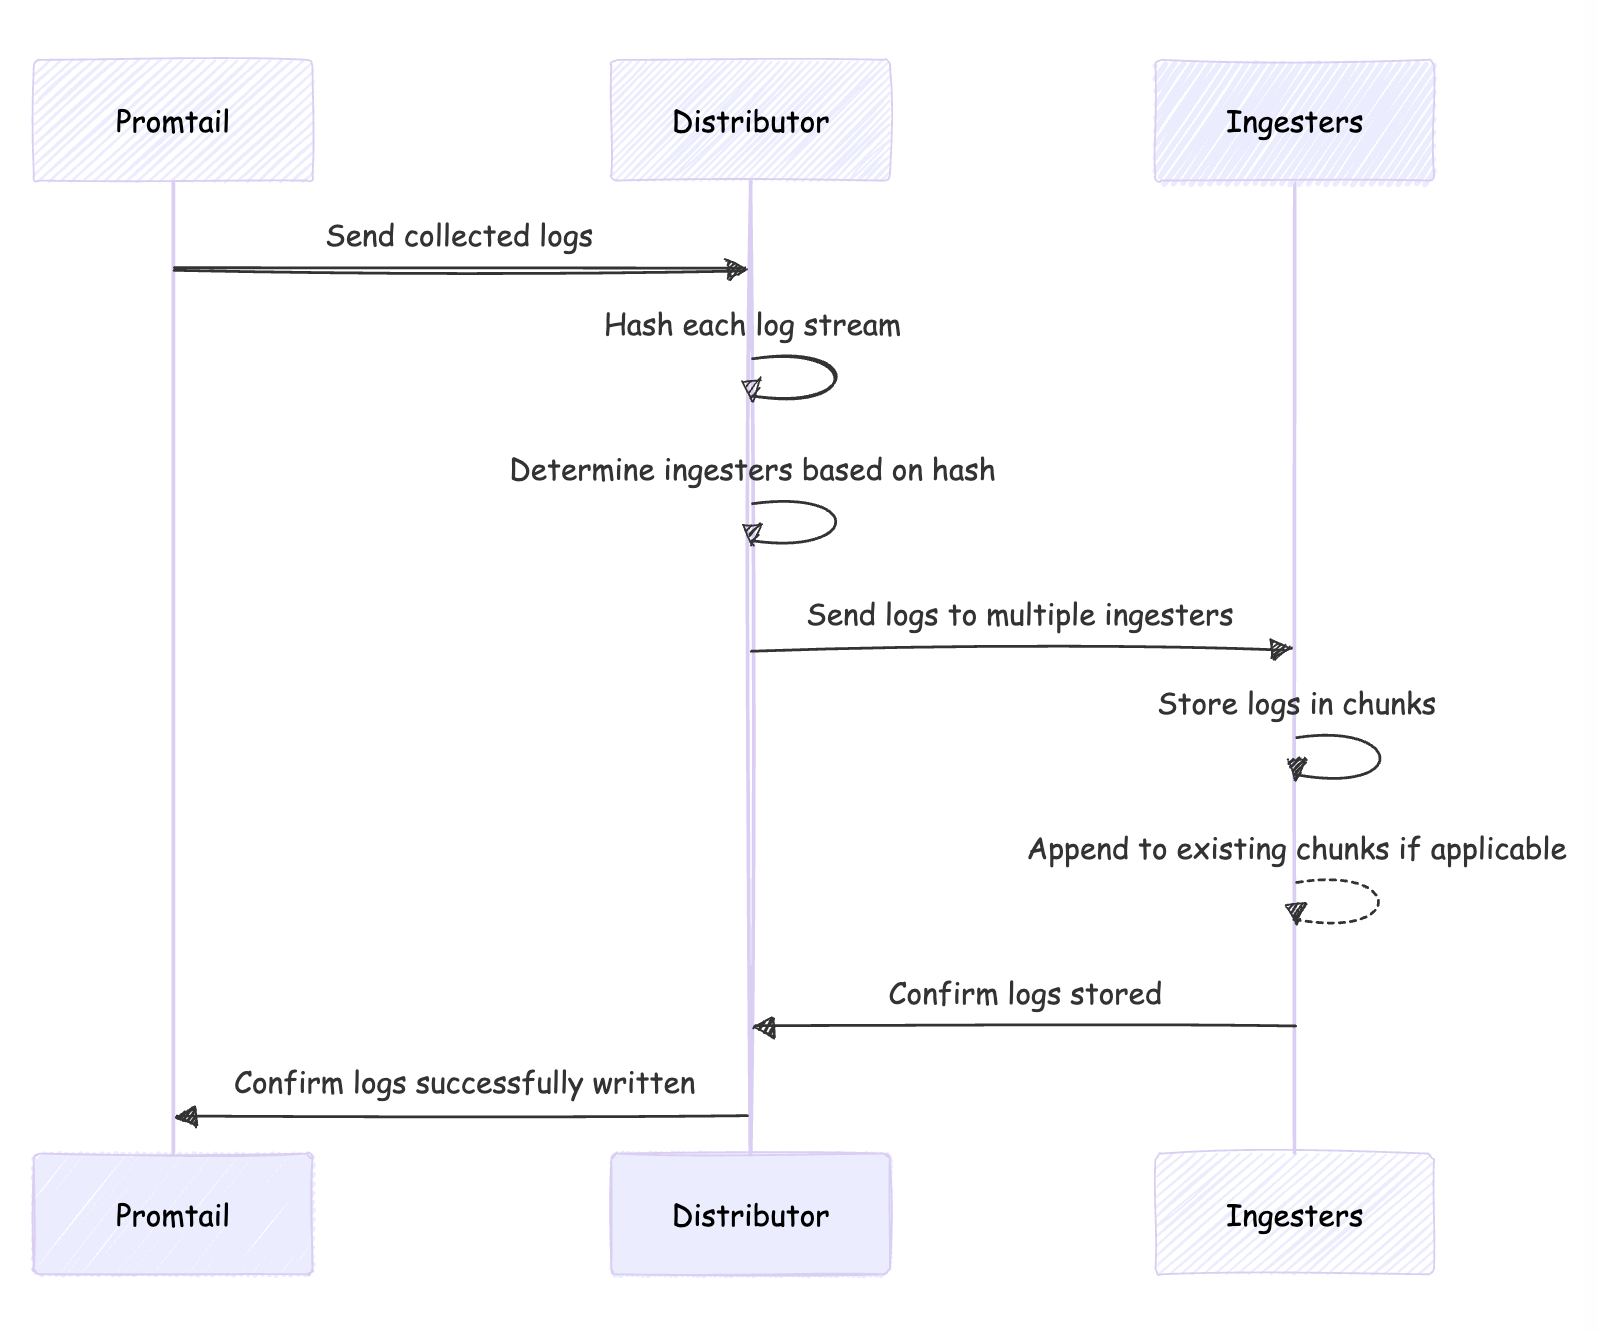
- Distributor Receives Logs: The distributor processes but doesn’t store logs.
- Hashing Log Streams: It hashes each log stream to create a unique identifier.
- Determining Ingesters: Based on the hash, the distributor assigns logs to ingesters.
- Sending Logs: Logs are sent to multiple ingesters for redundancy.
- Ingesters Process Logs: Ingesters store logs in compressed chunks, appending to existing chunks if needed.
Reading Logs (Read Path)
Now, let’s say a user wants to search for specific logs. They send a request with a LogQL query, asking Loki for those logs.
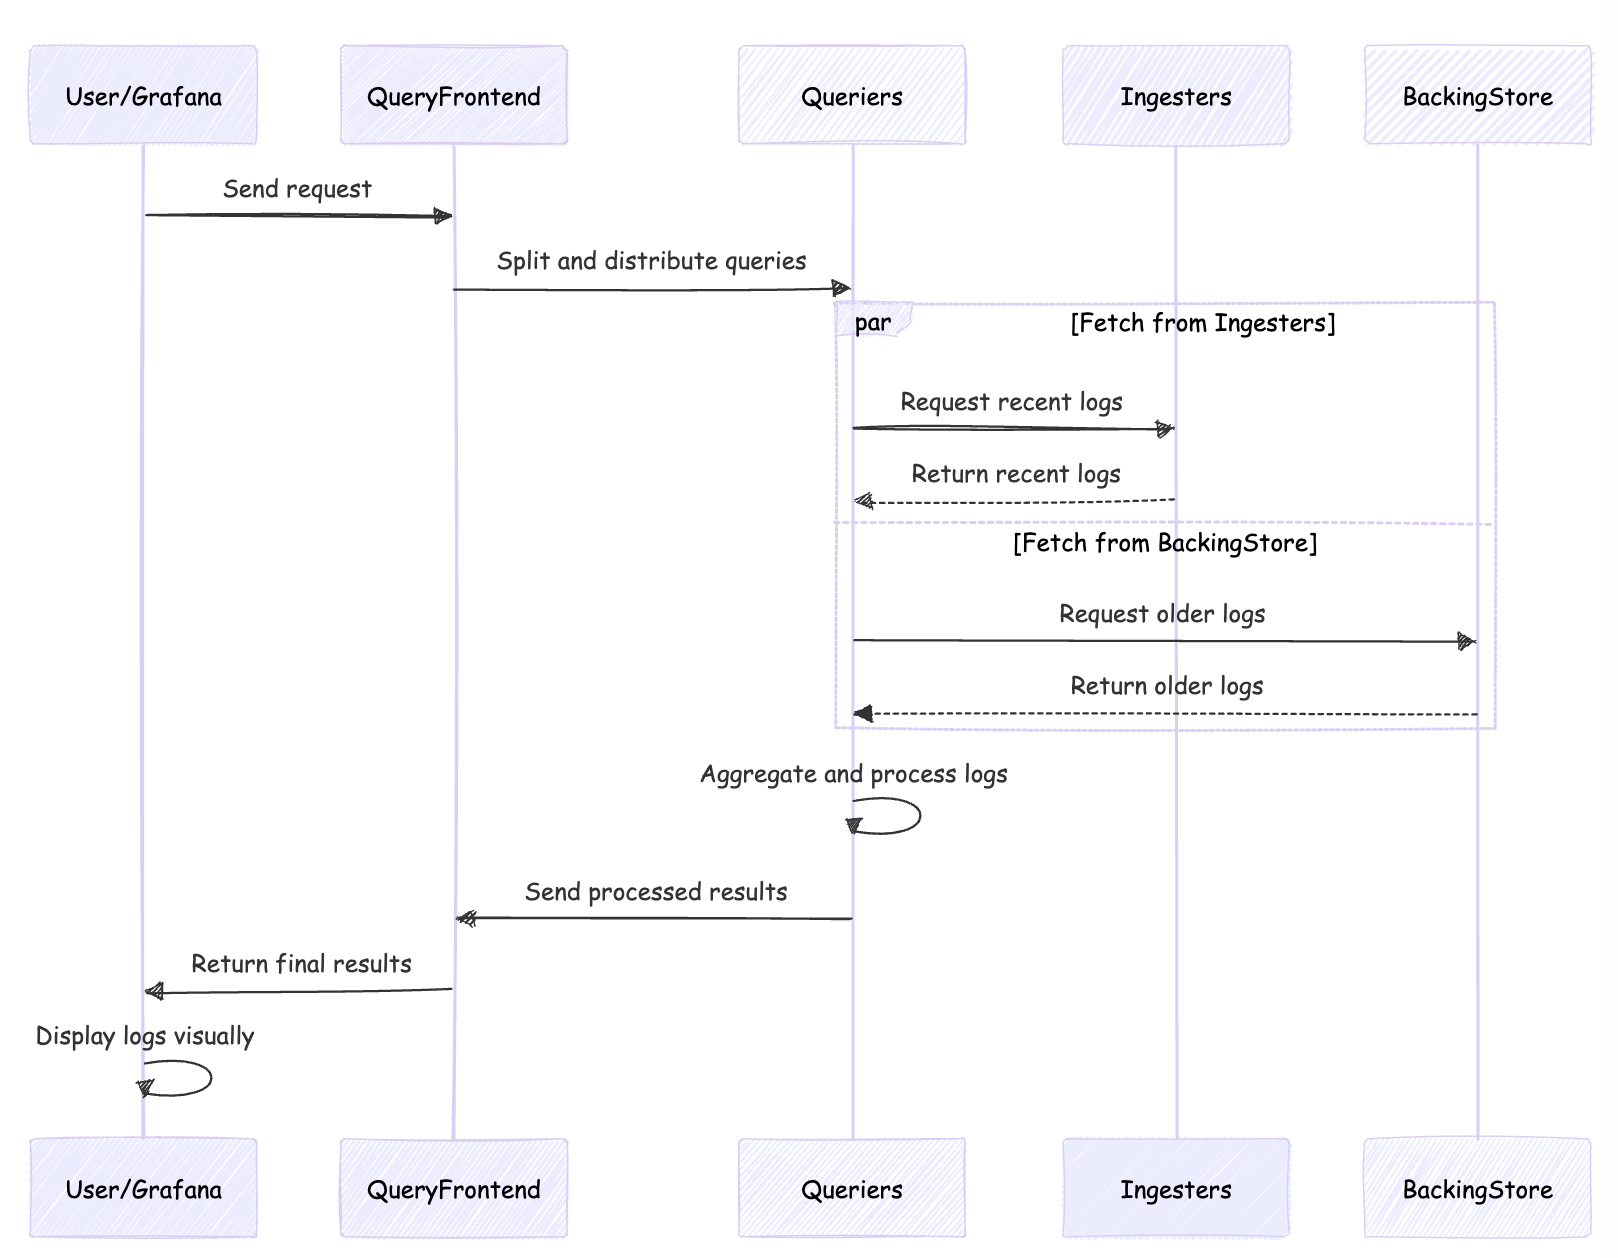
- User's Request to Query Frontend: The user (typically Grafana) sends a request to the Query Frontend.
- Queriers Retrieve Logs: The Query Frontend splits the request and sends it to Queriers, which fetch logs from Ingesters and the Backing Store.
- Data Aggregation and Processing: Queriers aggregate, deduplicate, and organize the log data.
- Results Merged and Sent Back: Processed results are sent back to the Query Frontend, which then returns the final results to the user.
- Grafana Displays Logs: The user (Grafana) displays the logs in a visual format for analysis.
Now that we’ve covered the workflow of Loki, let’s break down the different components that make up the system. Each component plays a specific role, making Loki efficient and lightweight. We’ll explain each one in detail, covering all the features that make these components work.
- Distributor
The distributor is the first component that handles incoming logs. It acts like a gatekeeper, deciding where to send logs for storage. The distributor receives logs and hashes the log streams based on their labels to figure out which ingester should handle them.
It distributes the logs across multiple ingesters, ensuring even load distribution. The distributor also plays a key role in ensuring log reliability by sending log data to multiple replicas (based on the replication factor), which ensures that if one ingester goes down, the logs are still safe.
- Ingester
The ingester is responsible for storing and managing logs. After receiving logs from the distributor, the ingester stores them in chunks, which are compressed pieces of log data.
However, before sending these logs to long-term storage (such as S3 or another object store), the ingester keeps recent logs in memory. This helps improve query performance because when you search for recent logs, the ingester can quickly return them from memory instead of having to fetch them from slower, long-term storage.
The ingester also manages log replication by ensuring that multiple copies of logs are stored across different ingesters, depending on the replication factor.
- Query Frontend
The query frontend handles the user’s search requests for logs. It splits larger queries into sub-queries for faster processing. The query frontend then distributes these sub-queries to the queriers, making the search process more efficient.
By breaking the query into smaller parts, the query frontend improves search performance and ensures that users can get their results faster, even when dealing with large datasets.
- Querier
The querier is responsible for retrieving logs. It checks the ingesters for recent logs stored in memory, and if the requested logs are not available in memory, it retrieves them from the backing store.
The querier is also responsible for deduplication. This means that if the same log appears more than once (due to replication), the querier removes duplicates and ensures the user gets only the necessary data.
- Ruler
The ruler in Loki handles alerting and recording rules. It continuously evaluates rules based on your log data. For instance, if you want to be notified whenever a certain error appears in your logs, you can set up a rule, and the ruler will monitor the logs for that pattern.
The ruler can also trigger alerts or store results based on these rules, making it an essential tool for proactive monitoring and alerting.
- Compactor
The compactor plays a key role in managing logs over time. As logs are ingested and stored in chunks, these chunks can become inefficient or fragmented. The compactor merges smaller chunks into larger ones, optimizing storage and improving performance.
But that’s not all—the compactor also manages log retention. For example, if you have a policy to delete logs after 24 hours, the compactor will take care of that by ensuring that old logs are removed according to your retention policies. This ensures that storage space is freed up and old logs don’t unnecessarily take up resources.
The compactor works in the background, cleaning up and optimizing the log data as it grows over time.
- Backing Store
The backing store is where logs are stored after they are no longer needed in memory. Loki typically uses object storage systems like S3 to store older logs in compressed chunks.
When a user queries for older logs, the querier retrieves them from the backing store. This long-term storage ensures that logs from days, weeks, or even months ago are still available, without taking up space in memory. It’s ideal for managing large volumes of logs efficiently.
- Chunk
A chunk is a compressed piece of log data. Instead of storing logs as large, uncompressed files, Loki breaks them into chunks and compresses them to save space.
Chunks belong to specific label sets, such as “app=backend” or “env=production,” making it easier to filter and search for logs. Over time, the chunks are moved from memory to long-term storage in the backing store. Chunks ensure that log storage is efficient and that large amounts of logs can be managed without requiring too many resources.
- Index
The index helps Loki quickly locate logs based on their labels. Instead of indexing the entire content of the logs (which would be resource-intensive), Loki indexes only the labels. These labels act like tags, such as “app=frontend” or “env=production,” that describe the logs and make it easier to find them later.
The index acts like a directory, allowing Loki to quickly find the right chunk of data based on the labels. This speeds up log searches and ensures that even large volumes of logs can be searched efficiently.
Installing Loki
In this setup, we have installed Loki as part of our observability stack, ensuring seamless log management for environments with small to moderate log volumes. Here’s a high-level overview of how we implemented Loki in this environment.
Steps We Followed to Install Loki:
- Choosing the Right Installation Approach: For this setup, we opted for the monolithic Loki deployment, which is ideal for small-scale setups. It’s a great choice for environments where log volume is moderate, allowing you to get started quickly.
- Configuring with Helmfile: Using a custom Helmfile configuration, we deployed Loki with AWS S3 for secure log storage and Grafana for intuitive log visualization. This setup allows for smooth integration and easy management of log data.
- Enabling Promtail and Grafana: We also enabled Promtail to automatically collect logs from the environment and integrated Grafana as the primary dashboard for visualizing logs in real-time.
For a more in-depth look at the entire installation process, including step-by-step instructions, check out our detailed guide: https://www.kubeblogs.com/how-to-install-loki-using-helm/
Loki vs. Elasticsearch: Which is Better?
Loki and Elasticsearch are two popular choices for log management, but they operate differently.
Feature | Loki | Elasticsearch |
|---|---|---|
Log Storage and Indexing | Indexes only labels (metadata), stores logs in compressed chunks, saving storage and costs. | Indexes everything, including full log content, allowing for full-text search but at higher storage cost. |
Querying and Search | Uses LogQL to query logs based on labels (metadata). Great for filtering by specific tags (e.g., app, environment). | Supports full-text search, allowing for advanced searches within the log content. Ideal for complex queries. |
Performance and Scalability | Scales efficiently with high log volumes due to its lightweight indexing of metadata. Ideal for Kubernetes environments. | Scalable but requires more resources (storage, memory, hardware) as log volume and indexing needs increase. |
Cost | More cost-effective due to minimal storage needs and indexing only metadata. Best for handling large amounts of logs at lower cost. | Higher cost due to full-text indexing and larger infrastructure requirements. Suited for complex search needs but at a higher price. |
Use Cases | Best for metadata-based searches (e.g., Kubernetes logs), where full-text search is not required. Lightweight and easy to manage. | Ideal for setups that need full-text search and advanced log analysis, such as searching for specific patterns in logs. |
FAQ Section
Here are some common questions about Loki and how it works:
- Does Loki support full-text search?
No, Loki is designed to work with labels (metadata) rather than full-text indexing. It focuses on indexing only labels such as app name, environment, etc., which makes it lightweight and cost-effective. If you need full-text search, Elasticsearch is the better choice.
- Can Loki handle large log volumes?
Yes, especially with a scalable setup. Loki can efficiently manage large volumes of logs, especially in Kubernetes environments. The monolithic setup can handle around 20-30 GB of logs per day, while the scalable version can handle up to 1 TB of logs per day.
- Is Loki suitable for production environments?
Loki can be used in production, but the monolithic setup is not recommended for large-scale production environments. For production, you should use the scalable Loki setup to handle larger log volumes and to ensure high availability.
- How does Loki store logs?
Loki stores logs in compressed chunks, using label-based indexing. Logs are stored in object storage like S3 when not needed in memory. This approach helps reduce storage costs while making logs easy to retrieve when needed.
- Can I visualize logs with Loki?
Yes, Loki is designed to work with Grafana, which provides a visual interface for querying and visualizing logs. You can set up dashboards in Grafana to view and monitor logs in a graphical format.
Conclusion
Loki offers a lightweight, efficient approach to log management, especially for setups that don’t require full-text search. It’s perfect for environments where you need to filter logs based on labels and want to keep costs low.
With its ability to scale and integrate smoothly with Grafana, Loki is an excellent choice for managing logs in modern infrastructures like Kubernetes.
In this blog, we covered everything from Loki’s components to how it compares with Elasticsearch.
Whether you’re working with small-scale log volumes or need a more robust, scalable solution, Loki has a place in your toolkit.
At KubeNine we help our customers onboard to Loki and integrate with Grafana to improve observability. Reach out to us more information at kubenine.com!