Table of Contents
Introduction
Managing cloud spend is a persistent challenge for engineering organizations. A single misconfigured autoscaling policy, forgotten test environment, or unexpected traffic pattern can result in thousands of dollars in unplanned expenses.
Checking AWS Cost Explorer manually or waiting for monthly billing statements means we often discover cost spikes days or weeks after they occur—when it’s too late to prevent the damage.
To address this challenge, we implemented AWS Cost Anomaly Detection, a machine learning-powered system that continuously monitors our AWS spending and alerts us within hours of unusual cost patterns.
The Problem: Cost Spikes Go Unnoticed
Challenges usually faced:
Delayed Discovery
Manual cost reviews happened weekly at best, meaning cost spikes could run for 5-7 days before anyone noticed. With an average AWS spend of ~$10,000/month, even a single day of 50% cost increase represents ~$150 in waste.
Lack of Pattern Recognition
AWS costs naturally fluctuate: - Weekdays vs. weekends (30% lower on weekends) - Business hours vs. overnight (20% lower overnight) - Month-end processing spikes - Seasonal variations
Static thresholds can’t distinguish between expected patterns and genuine anomalies.
Our Solution: AWS Cost Anomaly Detection
AWS Cost Anomaly Detection uses machine learning to learn our normal spending patterns and automatically detect unusual cost behavior. Instead of fighting static thresholds, we let AWS’s ML models understand what “normal” looks like for our specific usage patterns.
Why We Chose This Approach
- Zero Maintenance: AWS manages the ML models; we just configure thresholds
- Context-Aware: Understands weekly patterns, time-of-day variations, and service-specific trends
- Free Service: No cost for anomaly detection itself (we only pay for Cost Explorer API calls)
- Actionable Alerts: Includes root cause analysis (service, region, usage type)
- Proven Technology: Same ML models AWS uses internally for their own cost management
How It Works
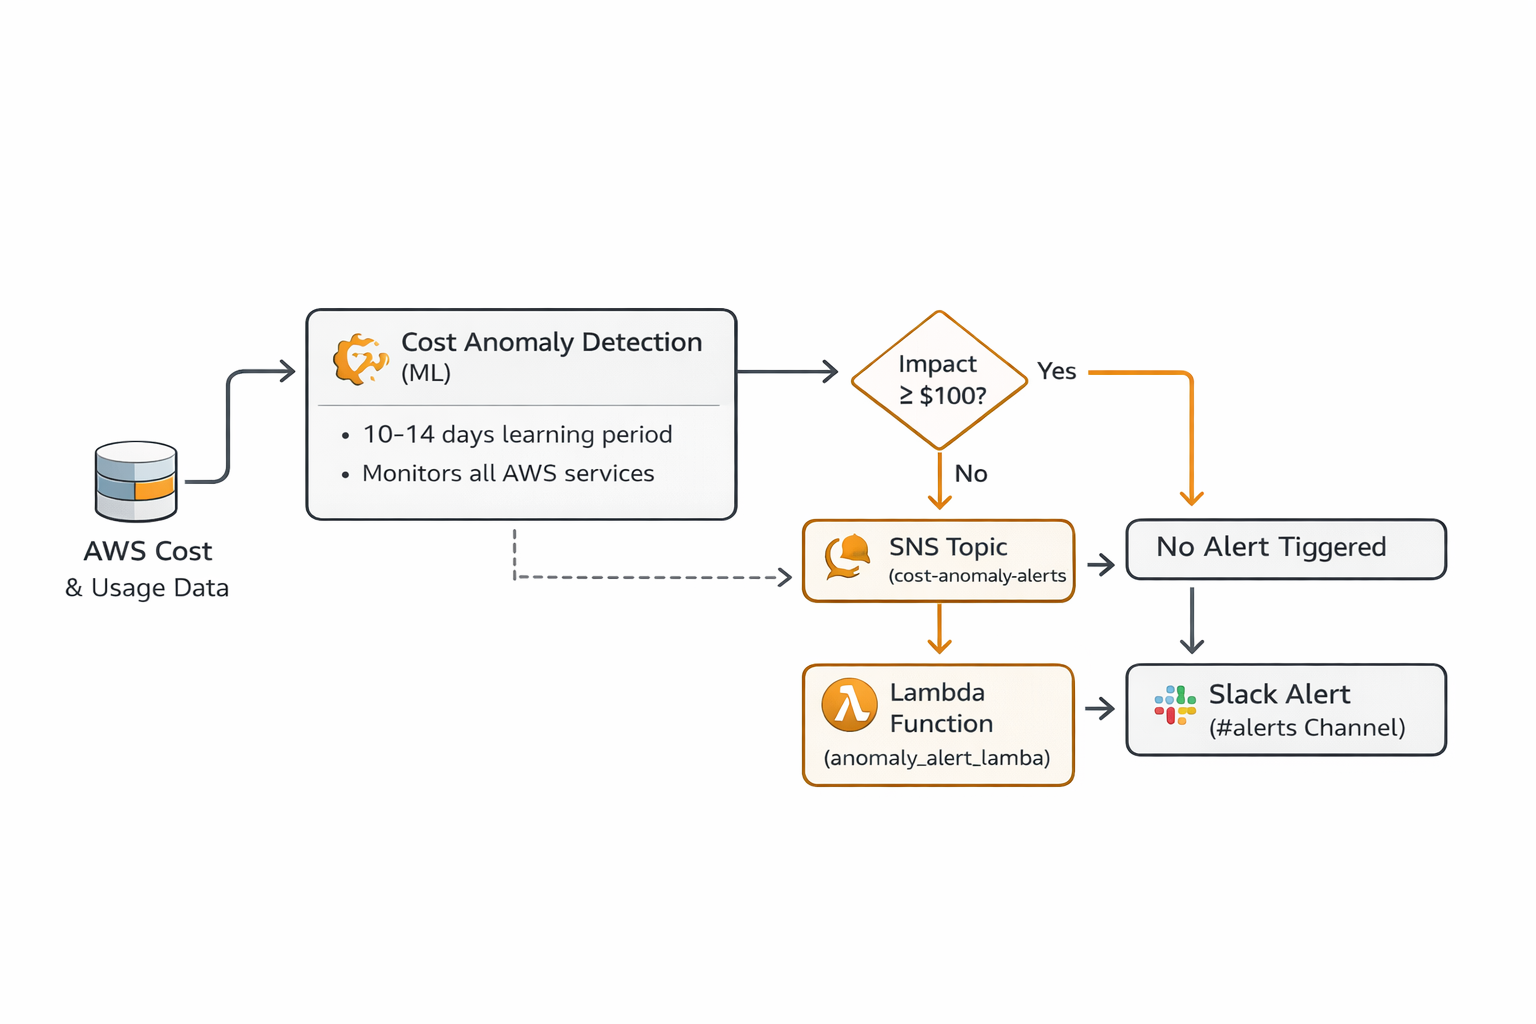
Architecture Overview
AWS COST ANOMALY DETECTION
Machine Learning in Action
AWS Cost Anomaly Detection employs several ML techniques:
- Pattern Learning: Analyzes 10-14 days of historical data to establish baseline behavior
- Temporal Patterns: Recognizes daily, weekly, and monthly cycles
- Service-Specific Models: Each AWS service gets its own behavioral model
- Continuous Adaptation: Models update as usage patterns evolve
- Anomaly Scoring: Each detection receives a severity score (0.0 to 1.0)
What It Detects: - Sudden cost spikes (30%+ increase from expected) - Gradual increases that deviate from trend - Unusual weekend/overnight spending - New services appearing in your bill - Geographic cost shifts (unexpected regions)
What It Ignores: - Expected fluctuations within normal range - Gradual growth aligned with historical trends - Scheduled maintenance windows (if configured)
Our Implementation
Infrastructure Components
We implemented this using Infrastructure as Code (Terraform) to ensure reproducibility and version control. The implementation consists of four key components:
Cost Anomaly Monitor
resource "aws_ce_anomaly_monitor" "cost_monitor" {
  name              = "aws-cost-monitoring-monitor"
  monitor_type      = "DIMENSIONAL"
  monitor_dimension = "SERVICE"
}
Configuration: - Type: DIMENSIONAL (monitors by AWS service) - Scope: All AWS services across all regions - Granularity: Daily cost aggregation
Cost Anomaly Subscription
resource "aws_ce_anomaly_subscription" "cost_anomaly_subscription" {
  name      = "aws-cost-monitoring-subscription"
  frequency = "IMMEDIATE"

  monitor_arn_list = [
    aws_ce_anomaly_monitor.cost_monitor.arn
  ]

  subscriber {
    type    = "SNS"
    address = aws_sns_topic.cost_anomaly_alerts.arn
  }

  threshold_expression {
    dimension {
      key           = "ANOMALY_TOTAL_IMPACT_ABSOLUTE"
      values        = ["100"]
      match_options = ["GREATER_THAN_OR_EQUAL"]
    }
  }
}
Configuration: - Frequency: IMMEDIATE (alerts sent as soon as anomaly detected) - Threshold: $100 minimum impact (filters out noise) - Delivery: SNS topic for flexible routing
SNS Topic and Lambda Integration
resource "aws_sns_topic" "cost_anomaly_alerts" {
  name = "aws-cost-monitoring-anomaly-alerts"
}
resource "aws_sns_topic_subscription" "anomaly_lambda_subscription" {
  topic_arn = aws_sns_topic.cost_anomaly_alerts.arn
  protocol  = "lambda"
  endpoint  = aws_lambda_function.anomaly_alert.arn
}
Purpose: - SNS receives anomaly notifications from AWS - Lambda processes and formats for Slack - Decouples detection from notification (can add email, PagerDuty, etc.)
Lambda Function for Alert Formatting
Our Lambda function (anomaly_alert_lambda.py) performs three key functions:
Step 1: Parse SNS Message
def parse_sns_message(event):
    """Parse SNS message from Cost Anomaly Detection"""
    sns_message = json.loads(event['Records'][0]['Sns']['Message'])
    return sns_message
Step 2: Extract Key Information
# Extract anomaly details
service = anomaly_data.get('dimensionalValue', 'Unknown Service')
anomaly_date = anomaly_data.get('anomalyStartDate')
impact = anomaly_data.get('impact', {})
expected_spend = impact.get('totalExpectedSpend', 0)
actual_spend = impact.get('totalActualSpend', 0)
total_impact = impact.get('totalImpact', 0)
# Calculate severity
anomaly_score = anomaly_data.get('anomalyScore', {})
current_score = anomaly_score.get('currentScore', 0)
# Determine severity level
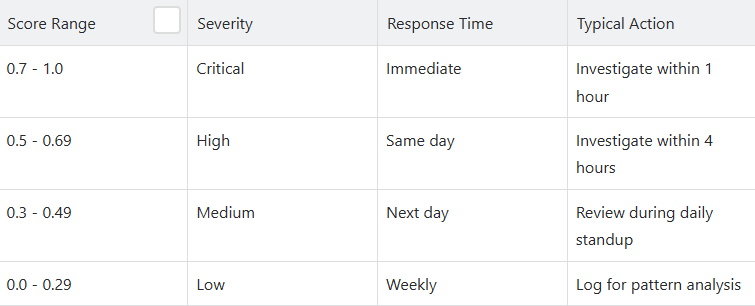
if current_score >= 0.7:
severity = "Critical"
elif current_score >= 0.5:
severity = "High"
elif current_score >= 0.3:
severity = "Medium"
else:
severity = "Low"
Step 3: Send to Slack
def send_to_slack(webhook_url, message):
"""Send formatted message to Slack"""
req = Request(webhook_url, json.dumps(message).encode('utf-8'))
req.add_header('Content-Type', 'application/json')
response = urlopen(req)
return responseConfiguration and Customization
Threshold Tuning
We set our anomaly threshold at $100 based on:
# In terraform.tfvars
anomaly_threshold_dollars = 100
Rationale: - Too low (e.g., $10): Alert fatigue from minor fluctuations - Too high (e.g., $500): Miss significant but moderate spikes - $100 sweet spot: Actionable alerts without noise
Our results: - Average 2-3 anomaly alerts per week - ~85% of alerts led to action (cost savings or fixing bugs) - ~15% were expected but worth confirming
Severity Classification
We categorize anomalies based on ML severity score:
Slack Integration
Alerts are color-coded based on severity:
# Color coding for visual priority
if current_score >= 0.7:
    color = "#ff0000"  # Red for critical
elif current_score >= 0.5:
    color = "#ff6600"  # Orange for high
elif current_score >= 0.3:
    color = "#ffcc00"  # Yellow for medium
else:
    color = "#36a64f"  # Green for low
This provides immediate visual context when the alert appears in Slack.
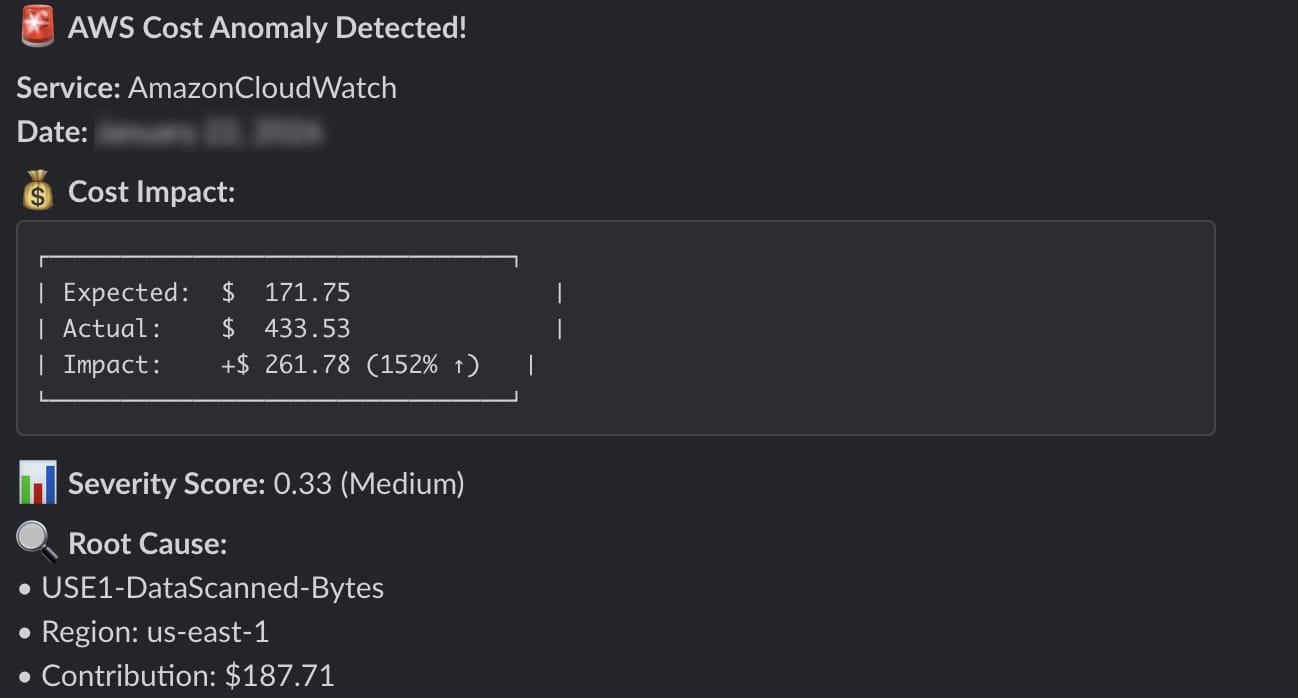
Screenshots and Visualization
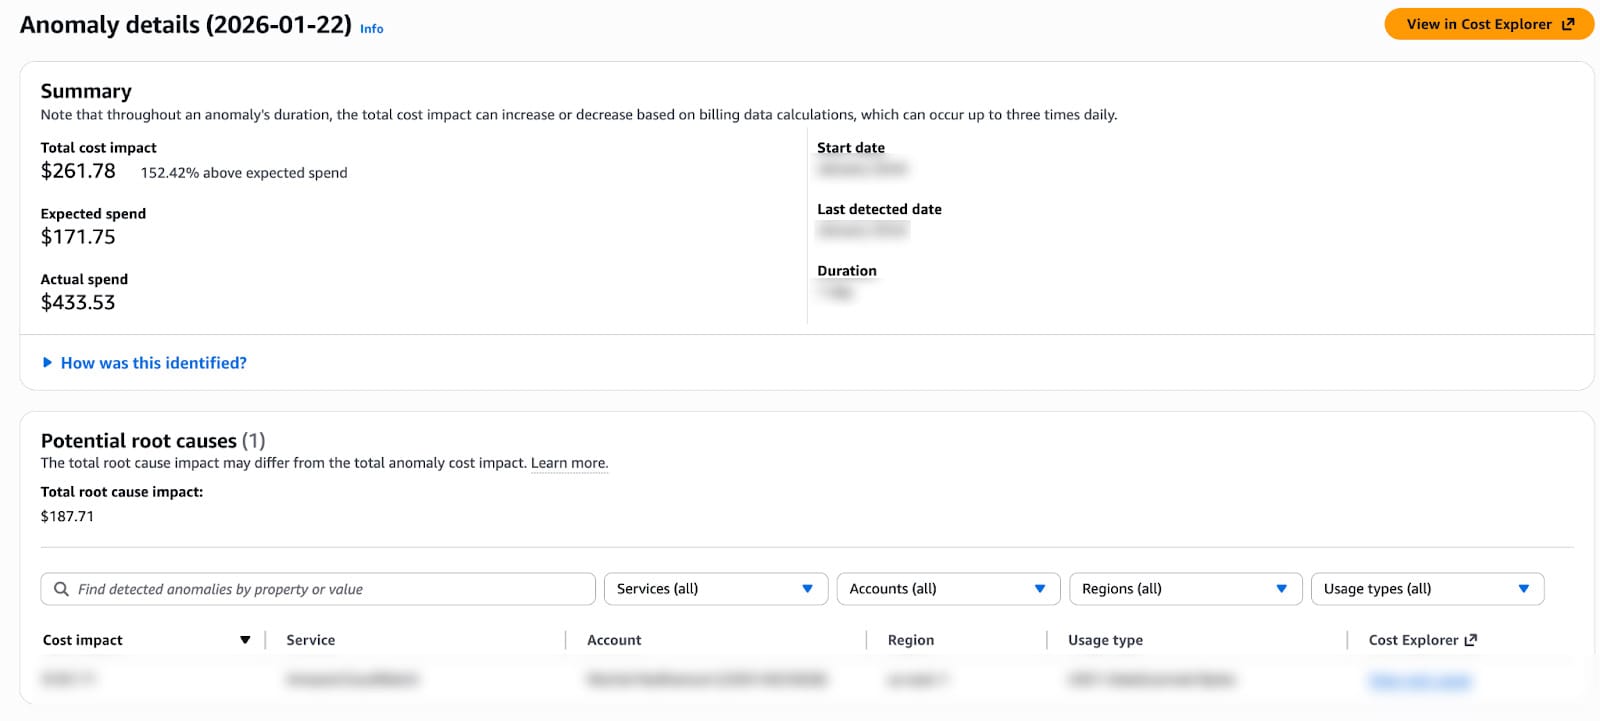
Screenshot 1: Anomaly Alert in Slack
Screenshot 2: AWS Cost Anomaly Detection Console
Best Practices
- Set appropriate thresholds: Start conservative ($100+) and adjust based on alert volume.
- Include context in alerts: Service, region, usage type, and direct investigation links.
- Color-code severity: Visual priority helps team triage.
- Document common patterns: Build runbook for frequent anomaly types.
- Review regularly: Monthly review of anomalies to identify systemic issues.
- Integrate with daily reports: Anomaly detection + daily visibility = complete picture
Cost of the System
Monthly Expenses
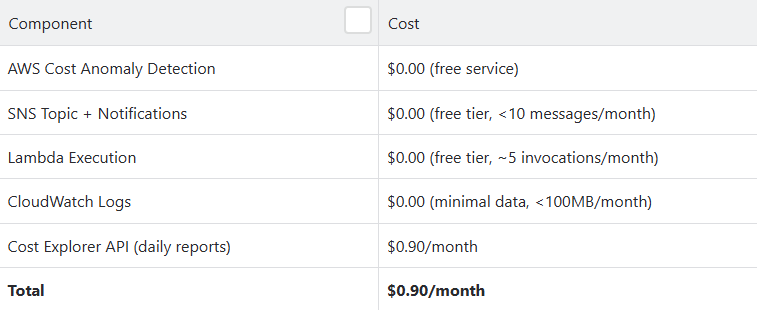
Note: The $0.90/month is primarily from our separate daily cost reporting Lambda that calls Cost Explorer API. The anomaly detection system itself has virtually zero direct cost.
Conclusion
Implementing AWS Cost Anomaly Detection has transformed approach of our customers towards cloud cost management. What was once a reactive, manual process of discovering cost spikes days after they occurred is now a proactive, automated system that alerts us within hours.
Key Takeaways
Machine learning beats static thresholds: Context-aware anomaly detection understands patterns humans can’t track manually
- Speed matters: Detecting spikes in 4 hours vs. 3 days prevents 94% of potential waste.
- Low maintenance: After initial setup, system runs autonomously with minimal oversight
- Actionable insights: Root cause analysis accelerates investigation and resolution
Get in touch with Kubenine team if you’re also struggling with your cloud spends!
Recent Posts