
On this page
Chart.js Django Tutorial: Create Interactive Charts and Dashboards.

Introduction
Data visualization is crucial for modern web applications, especially when dealing with analytics, dashboards, or business intelligence features. Django, with its robust backend capabilities, combined with Chart.js for frontend charting, creates a powerful combination for building data-rich applications.
This guide will walk you through integrating Chart.js into your Django application, from basic setup to advanced chart configurations, ensuring you can create professional-grade data visualizations that enhance user experience and decision-making capabilities.
Why Chart.js with Django?
Chart.js is a popular JavaScript charting library that offers:
- Responsive Design: Charts automatically adapt to different screen sizes
- Rich Chart Types: Line, bar, pie, doughnut, radar, and more
- Interactive Features: Hover effects, animations, and user interactions
- Lightweight: Minimal bundle size with excellent performance
- Easy Integration: Simple setup with Django templates
Prerequisites
- Django project with basic setup
- Basic knowledge of HTML, CSS, and JavaScript
- Understanding of Django views and templates
Step-by-Step Implementation
Step 1: Basic Setup
Create a Django app and add it to INSTALLED_APPS:
python manage.py startapp charts
Step 2: Create Model
# charts/models.py
from django.db import models

class SalesData(models.Model):
    month = models.CharField(max_length=20)
    revenue = models.DecimalField(max_digits=10, decimal_places=2)
    profit = models.DecimalField(max_digits=10, decimal_places=2)
Step 3: Create View
# charts/views.py
from django.shortcuts import render
from django.http import JsonResponse
from .models import SalesData

def dashboard(request):
    return render(request, 'charts/dashboard.html')

def sales_api(request):
    data = SalesData.objects.all()
    return JsonResponse({
        'labels': [item.month for item in data],
        'revenue': [float(item.revenue) for item in data]
    })
Step 4: Template with Chart.js
<!-- charts/templates/charts/dashboard.html -->
<!DOCTYPE html>
<html>
<head>
    <script src="https://cdn.jsdelivr.net/npm/chart.js"></script>
</head>
<body>
    <canvas id="salesChart"></canvas>

    <script>
        fetch('/api/sales/')
            .then(response => response.json())
            .then(data => {
                new Chart(document.getElementById('salesChart'), {
                    type: 'bar',
                    data: {
                        labels: data.labels,
                        datasets: [{
                            label: 'Revenue',
                            data: data.revenue,
                            backgroundColor: 'rgba(54, 162, 235, 0.6)'
                        }]
                    }
                });
            });
    </script>
</body>
</html>
Advanced Features
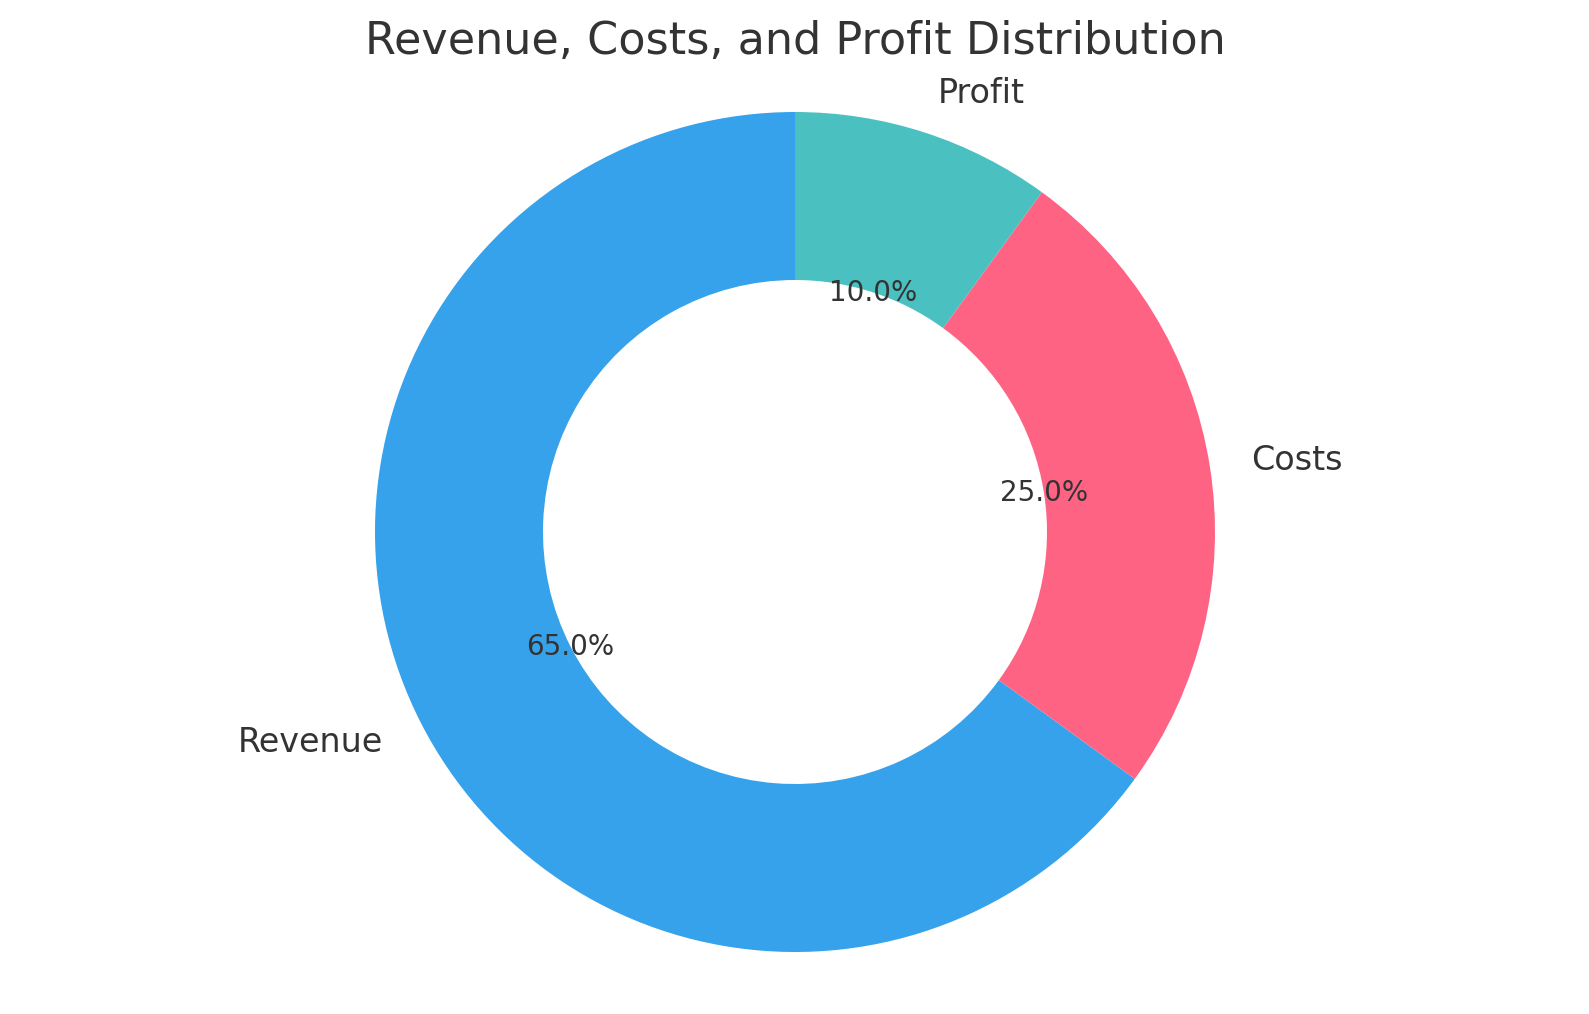
Custom Chart Types
// Doughnut chart example
new Chart(ctx, {
    type: 'doughnut', //change this for different graph type
    data: {
        labels: ['Revenue', 'Costs', 'Profit'],
        datasets: [{
            data: [65, 25, 10],
            backgroundColor: ['#36A2EB', '#FF6384', '#4BC0C0']
        }]
    }
});
Real-time Updates
// Update every 30 seconds
setInterval(() => fetch('/api/sales/'), 30000);
Chart Output
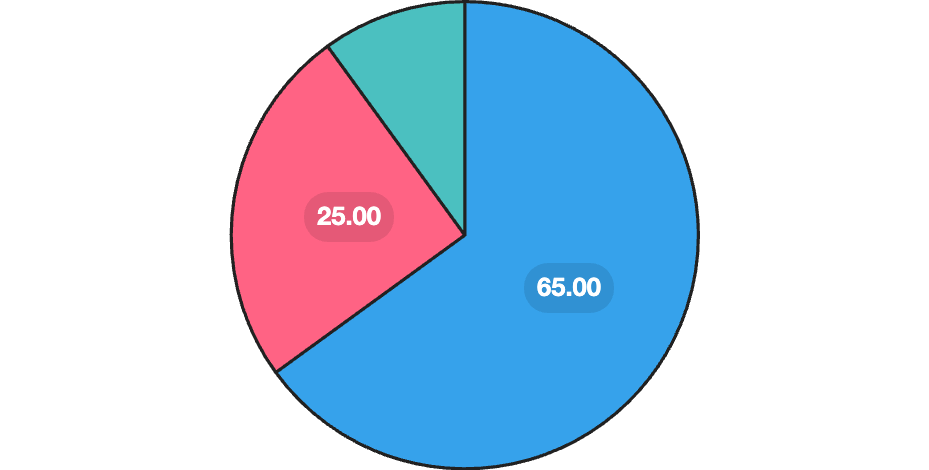
interactive chart
Best Practices
- Use
responsive: truefor mobile-friendly charts - Implement error handling for API calls
- Use
Chart.destroy()to prevent memory leaks - Test on different screen sizes
Common Chart Types
- Line: Time series data, trends
- Bar: Comparing categories
- Pie/Doughnut: Proportions, percentages
- Radar: Multi-dimensional comparison
Troubleshooting
- Check browser console for errors
- Verify Chart.js CDN loads correctly
- Ensure canvas has proper dimensions
Conclusion
Chart.js with Django creates powerful data visualizations. This guide covered:
- Basic setup and integration
- Creating models and API endpoints
- Building interactive charts
- Advanced features and best practices
Next Steps:
- Experiment with different chart types
- Add real-time data updates
- Implement interactive features
The combination enables compelling, data-driven applications.