
Table of Contents
Prometheus is an incredibly powerful tool for monitoring your systems. Its flexible data model and expressive query language, PromQL, make it one of the most popular choices in the observability world.
But — that flexibility comes at a cost.
When you're just starting out with Prometheus, it's easy to fall into certain traps that can cause performance issues, data overload, or alerts that don’t do what you expect. These issues can be subtle, and they often don't show up until you're deep into building your dashboards or alert rules.
In this post, I’ll walk you through six of the most common mistakes developers make with Prometheus, explain why they’re problematic, and show you exactly how to avoid them.
Let’s start with a classic one
Mistake 1: Cardinality Bombs
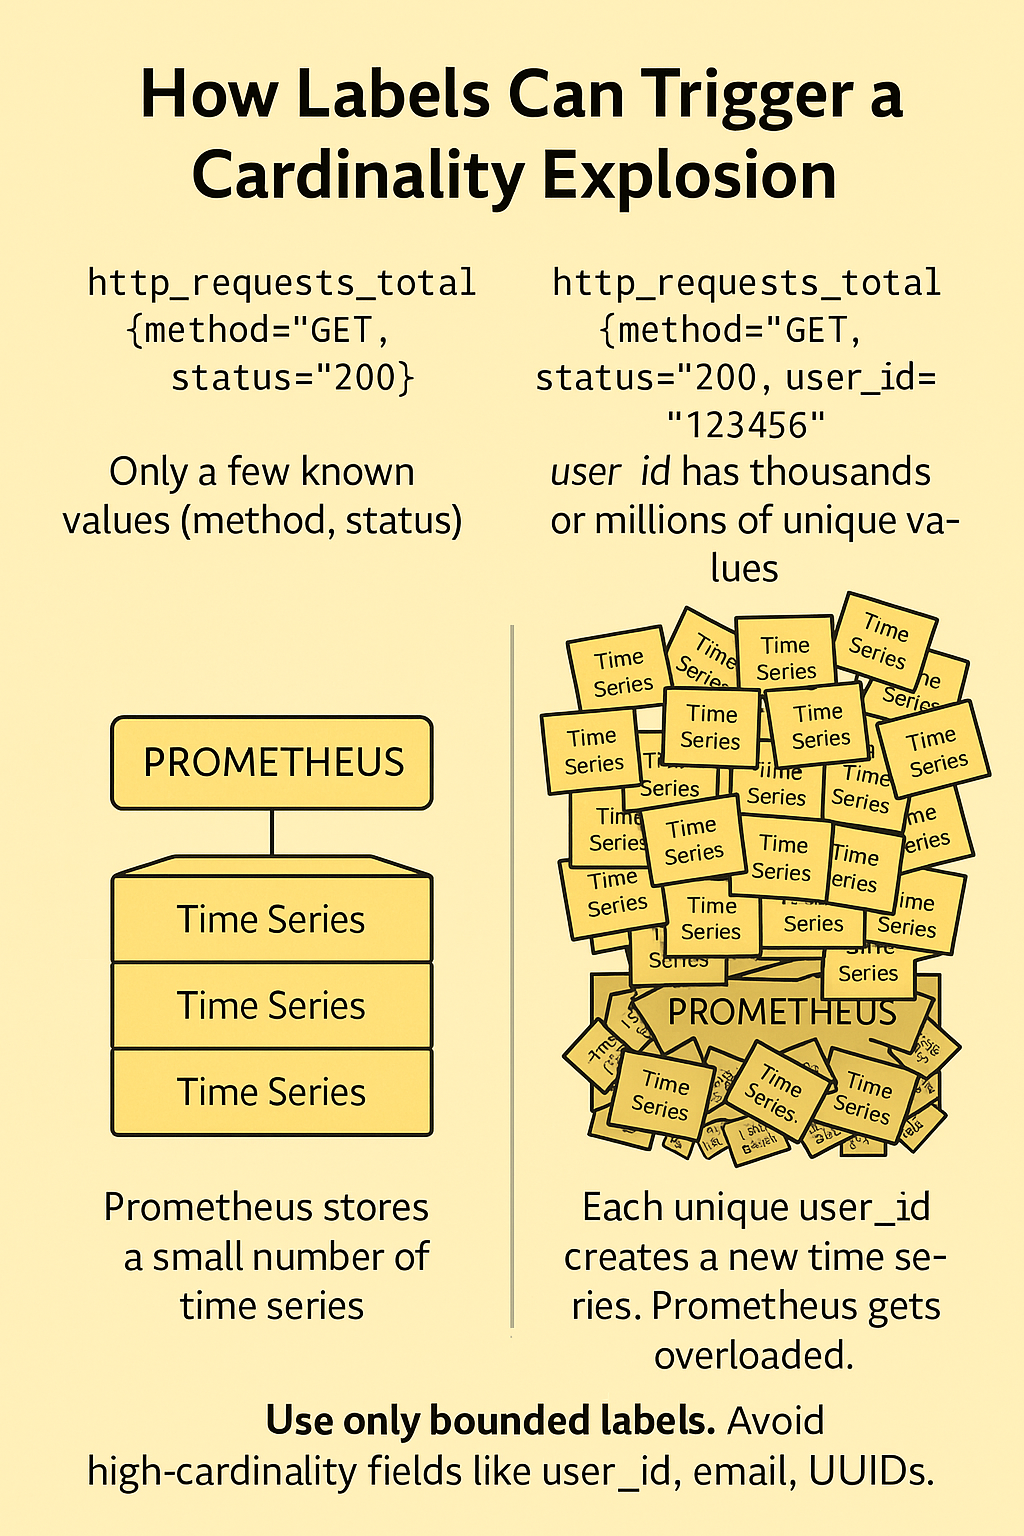
One of the most common and painful mistakes people make when starting out with Prometheus is accidentally creating what's known as a cardinality bomb. This happens when a metric is broken down by too many unique label values, which causes an explosion in the number of time series Prometheus needs to track.
In Prometheus, a time series is defined by the combination of a metric name and its label values. Each unique combination creates a new time series, which Prometheus has to store, index, and process. This is normally a great feature—it lets you filter and aggregate your metrics in powerful ways. But it becomes a problem when you start using labels that take on a large or even unbounded set of values.
Let’s look at an example. Say you're counting HTTP requests in your service using this metric:
http_requests_total This gives you a single time series. Now you decide to split this metric by the HTTP method, like GET or POST:
http_requests_total{method="GET"} http_requests_total{method="POST"} This creates two time series, one for each method. Still totally manageable.
Then you decide to also track which user sent each request. You add the user_id label:
http_requests_total{method="GET", user_id="123456"} This is where the problem starts. Now, every single unique user_id value creates a separate time series. If you have 1,000 users, that's 1,000 new time series. If you have a million users, Prometheus now needs to store and track a million individual time series for just this one metric.
And remember: this doesn’t scale linearly. Each additional label multiplies the number of possible combinations, and suddenly you’re hitting Prometheus' limits or exhausting your server’s memory.
This kind of explosion in time series count is one of the most common reasons Prometheus servers become unstable, slow, or completely unresponsive. It leads to high memory usage, long query times, and brittle alerting.
The key to avoiding this issue is to be intentional about which labels you use. Avoid labels with high cardinality—meaning labels that can have a large number of unique values. These often include things like user_id, email, UUID, full_url, or anything dynamic or user-generated.
Instead, use labels with a small, well-defined set of values. Good examples are method, status_code, region, or job. These labels typically don’t grow unbounded over time and are much safer to use.
Here’s a quick comparison:
Bad (high-cardinality):
sum(rate(http_requests_total[1m])) by (user_id) Good (low-cardinality):
sum(rate(http_requests_total[1m])) by (method, status) By avoiding high-cardinality labels and being mindful of how many unique combinations you're generating, you can prevent runaway time series growth and keep your Prometheus setup healthy and fast.
Mistake 2: Aggregating Away Too Many Labels
In Prometheus, aggregating metrics is a common and powerful technique — especially when writing alerts or building dashboards. But it’s easy to accidentally drop important labels during aggregation, and that can make your alerts harder to manage and understand.
Let’s say you’re tracking error rates across multiple services using this metric:
http_requests_total{status="500"}To create an overall error rate, you might write something like this:
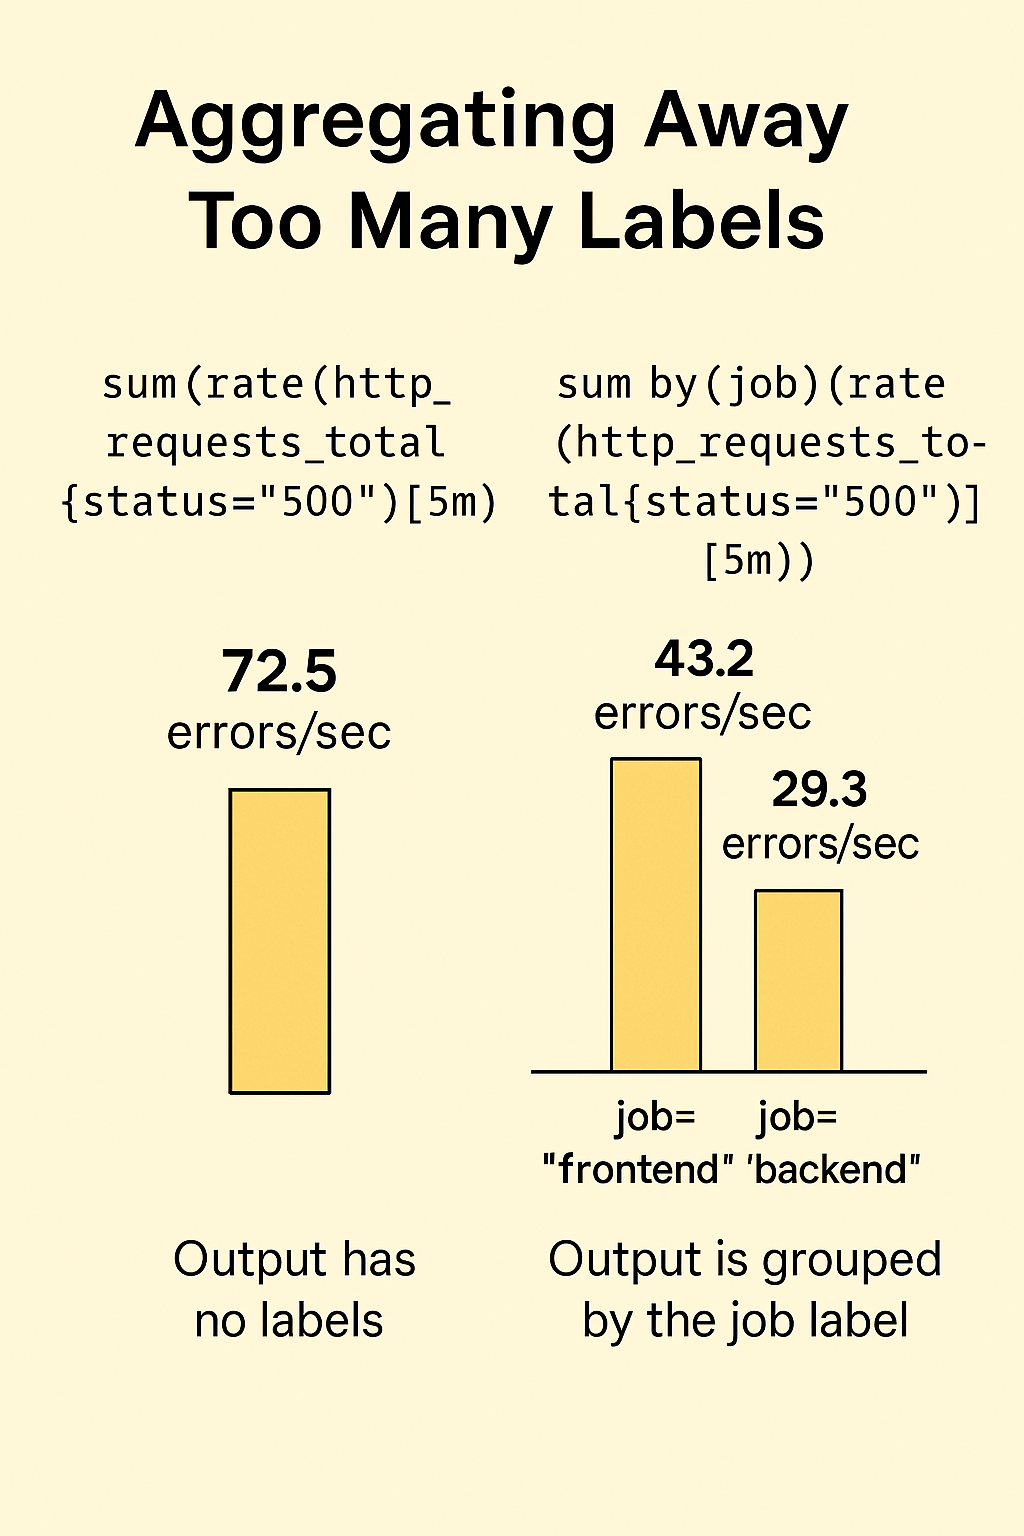
sum(rate(http_requests_total{status="500"}[5m]))This works — it gives you the total error rate. But there’s a catch: when you use plain sum(), you lose all the labels from the underlying time series. That includes labels like job, service, or instance — things that can help you trace the source of the problem.
Now imagine that alert fires. Without preserved labels, you won't know where the errors are coming from. You’ll see a number, but no context.
That’s why it's important to use the by() modifier with your aggregations — to keep specific labels you want to preserve. For example:
sum by(job)(rate(http_requests_total{status="500"}[5m]))Now your result still gives you error rates, but broken down by job. You get both the number and the context — making your alerts actionable.
If you want to drop all labels except specific ones, you can also use without(), but the idea is the same: don’t accidentally throw away useful information when you aggregate.
Label preservation becomes even more critical in alerts, because tools like Alertmanager rely on labels for routing, grouping, silencing, and notifications. Losing them early in the pipeline means less flexibility and control later on.
In short: sum() without by() can silently remove valuable signal from your data. Always be intentional about what you keep — and what you drop.
Mistake 3: Unscoped Metric Selectors
One of the lesser-known but sneaky issues in Prometheus is using unscoped metric selectors. When you're writing a PromQL query, it's tempting to just write something like:
http_requests_total
This seems fine at first — you're pulling all data for that metric. But here's the problem: in larger environments, multiple services might expose the same metric name. And they might not even mean the same thing.
You could be unintentionally selecting data from several completely unrelated jobs or services — even ones you didn’t intend to include. Worse, a new service might start exposing a conflicting metric in the future, and your alerting rules or dashboards will suddenly break or behave strangely.
Let’s say you’re building a dashboard for your frontend service, and you’re calculating the error rate like this:
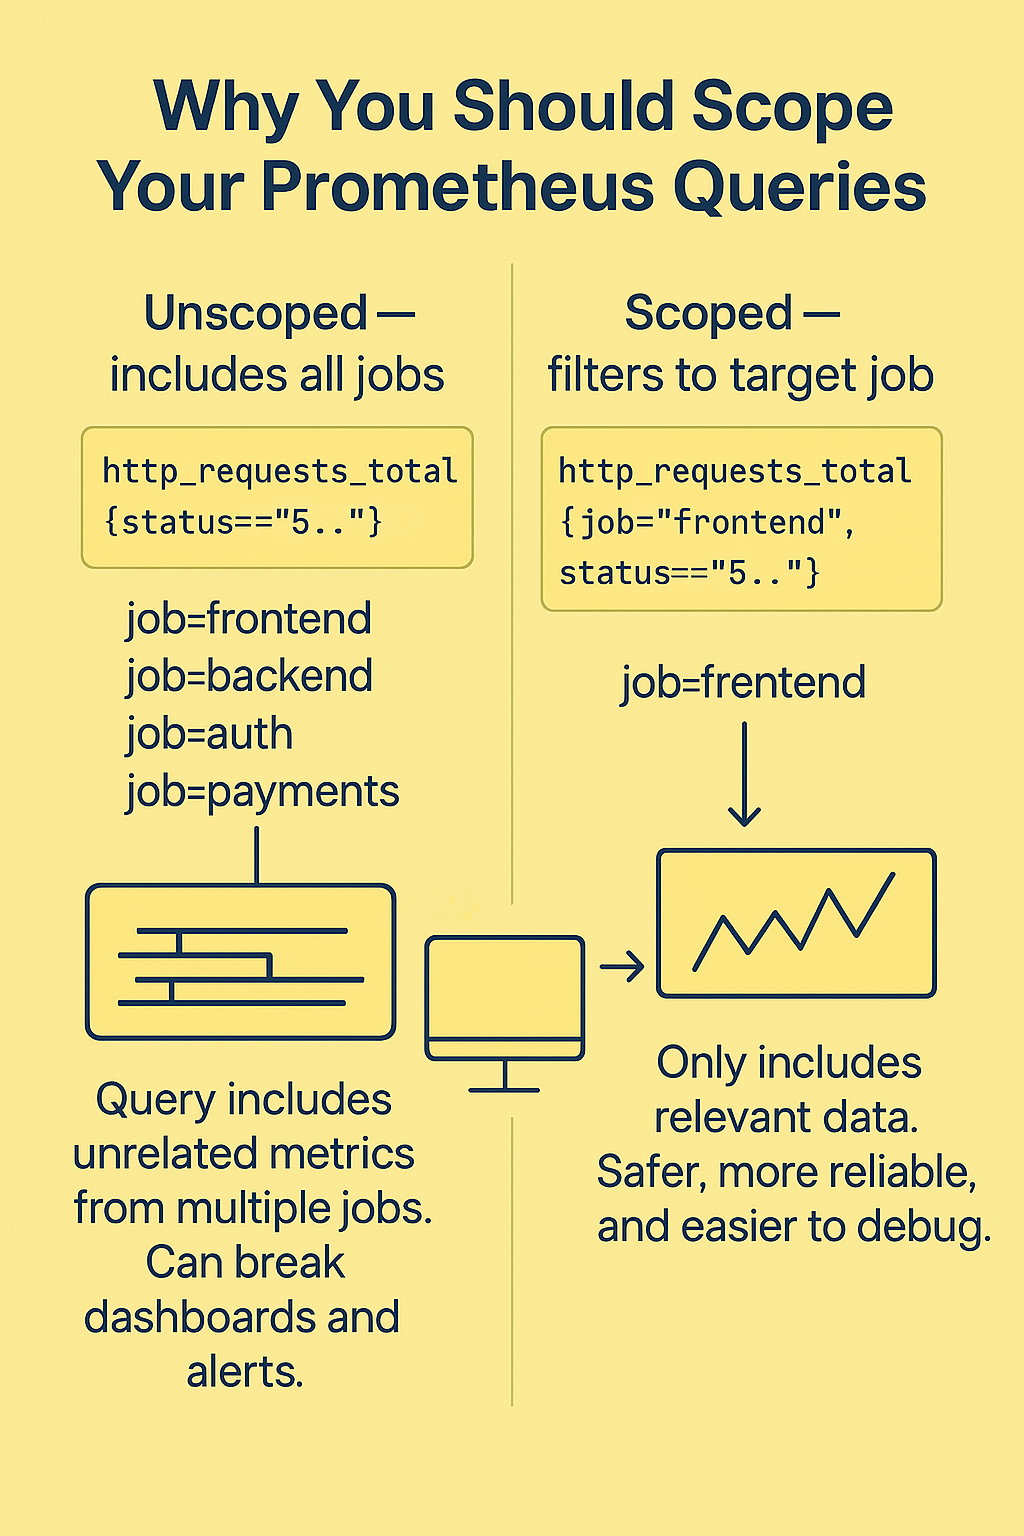
rate(http_requests_total{status=~"5.."}[5m])If you didn’t filter this by job or service name, you might be seeing error rates from backend, frontend, auth, or anything else using the same metric — even if they’re unrelated.
To prevent this, always scope your queries to the specific job or service you care about. Like this:
rate(http_requests_total{job="frontend", status=~"5.."}[5m])Now you're only selecting metrics coming from your frontend job, and you’re protected from conflicts in the future.
It’s a small habit that makes your queries and alerts more reliable and easier to understand — especially as your Prometheus setup grows.
Mistake 4: Missing "for" Durations in Alerting Rules
When writing alerting rules in Prometheus, it’s common to forget or skip the for duration — the field that defines how long a condition must be true before an alert actually fires. But this small detail plays a big role in the reliability of your alerts.
Let’s take a simple example:
You want to alert when a target goes down, so you write:
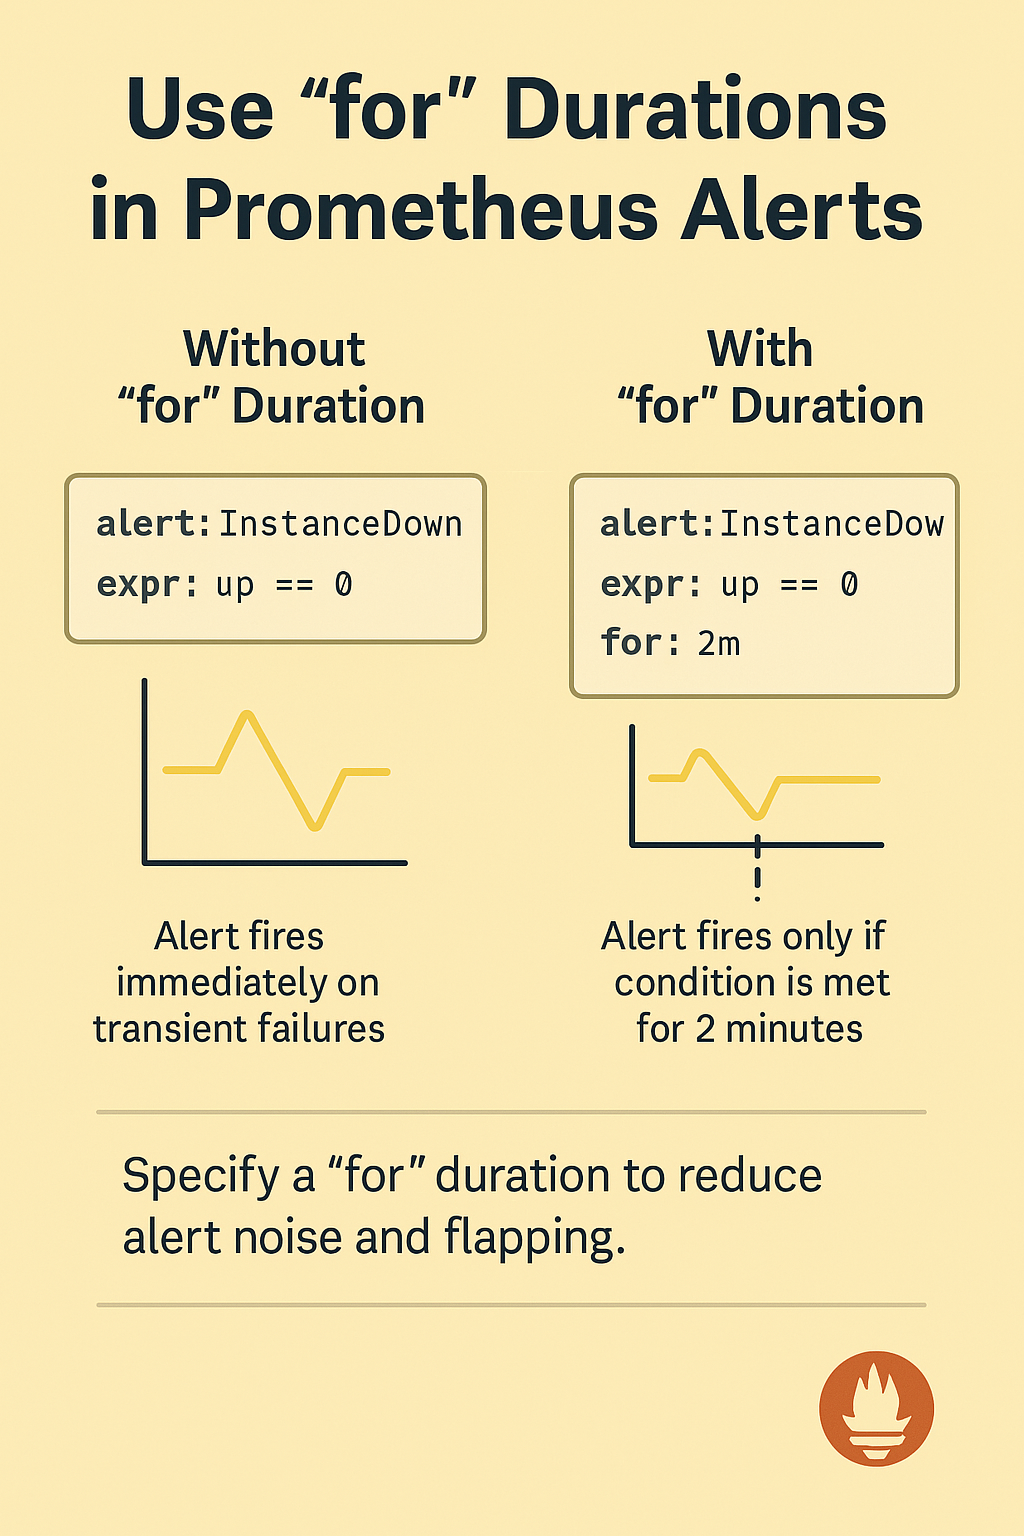
alert: InstanceDown
expr: up == 0
At first, this seems fine. But without a for: duration, the alert will fire immediately — even if the failure was just a temporary blip. A single scrape failure or a momentary network issue could trigger alerts that aren’t actionable.
That’s where the for: field comes in. It adds tolerance for short-lived issues.
For example:
alert: InstanceDown
expr: up == 0
for: 2m
Now Prometheus will only fire the alert if the instance has been down for two full minutes. This makes alerts more meaningful and reduces noise.
Even if your query already includes a time-averaged function like rate() or avg_over_time(), it’s still important to include a for: duration. Why? Because when the Prometheus server starts up or loses data, there may not be enough data points to truly represent that time window — and you might still get false positives.
Adding a for: value makes your alerting system more robust, but you should still find a balance. Too short, and you get noise. Too long, and you might miss important signals.
In general, use a for duration of at least 1–5 minutes for most alerting conditions, unless there's a strong reason to alert immediately.
Mistake 5: Using Too Short Rate Windows
In Prometheus, functions like rate(), irate(), and increase() are commonly used to calculate how fast counters are increasing. But they all require a window of data — and if that window is too small, you can run into problems.
Let’s say your Prometheus server scrapes metrics every 15 seconds. Now imagine writing a query like this:
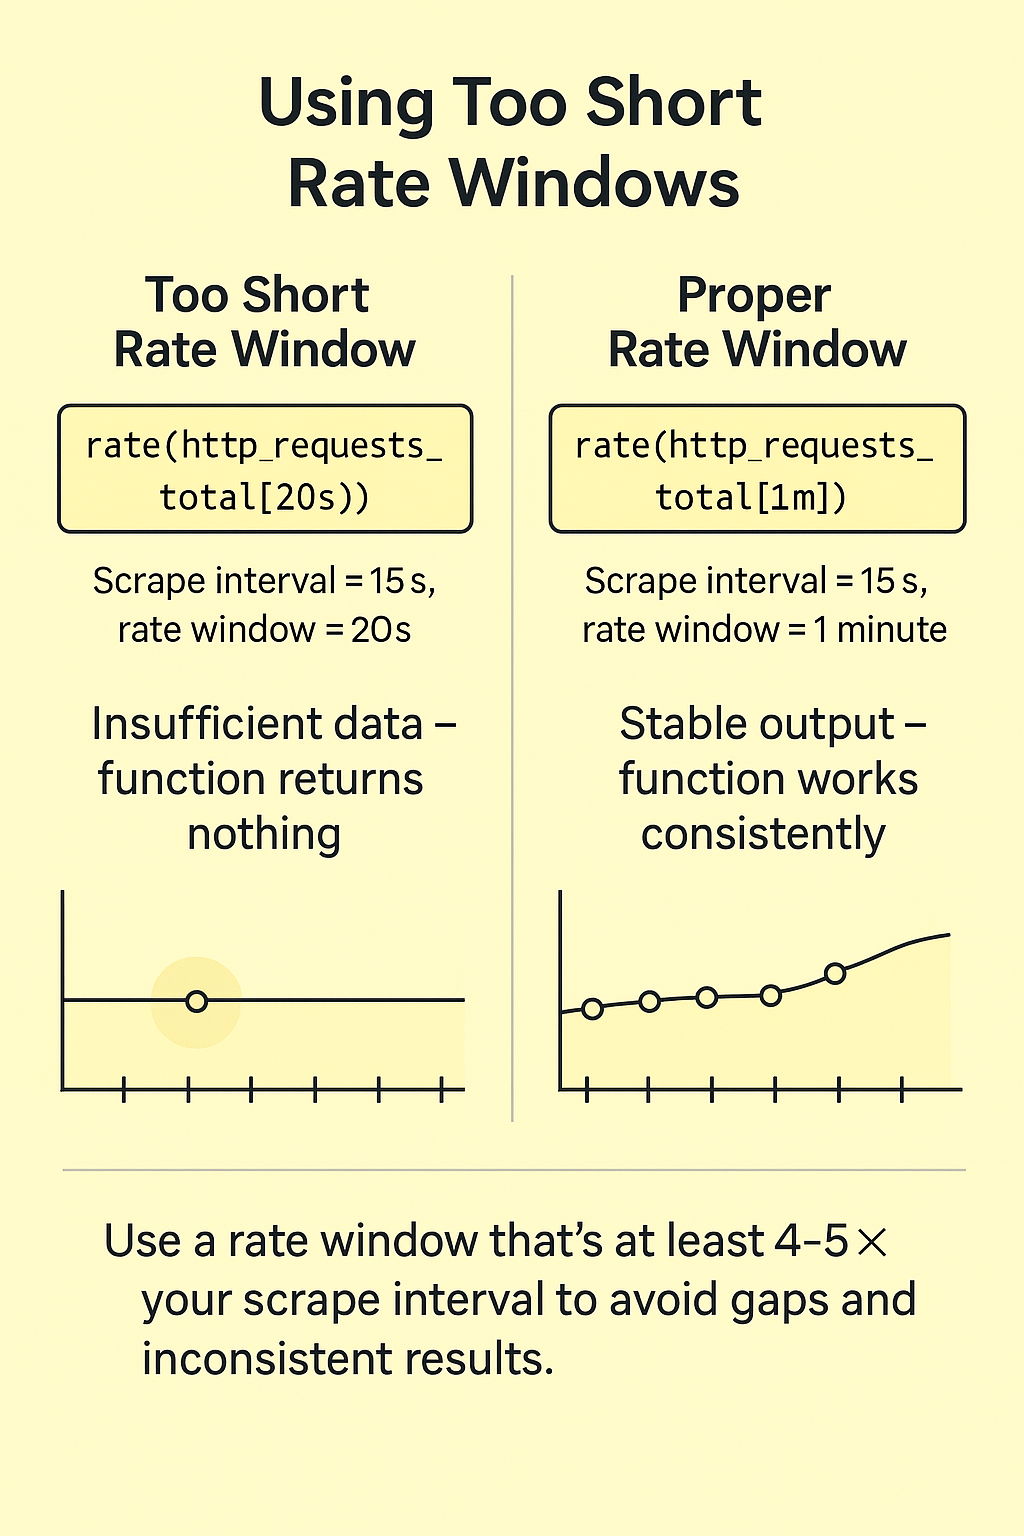
rate(http_requests_total[20s])That seems fine on the surface — you're asking for a rate over the past 20 seconds. But because your scrape interval is 15 seconds, there might only be one data point in that 20-second window. And rate() needs at least two points to work. If there aren't two, the function returns nothing at all.
The result? Gaps in your graphs. Inconsistent alert behavior. Empty dashboards.
This gets even worse if a scrape fails or arrives late. Now your 20-second window might contain zero points, and rate() just disappears entirely from the output.
The fix is simple: choose a window that's wide enough to reliably include at least two data points — even with occasional failures.
A good rule of thumb: set your rate window to at least 4–5x your scrape interval.
If you scrape every 15 seconds, use a window of at least 1 minute:
rate(http_requests_total[1m])This adds consistent output and makes your graphs and alerts more reliable.
Mistake 6: Using Functions With Incorrect Metric Types
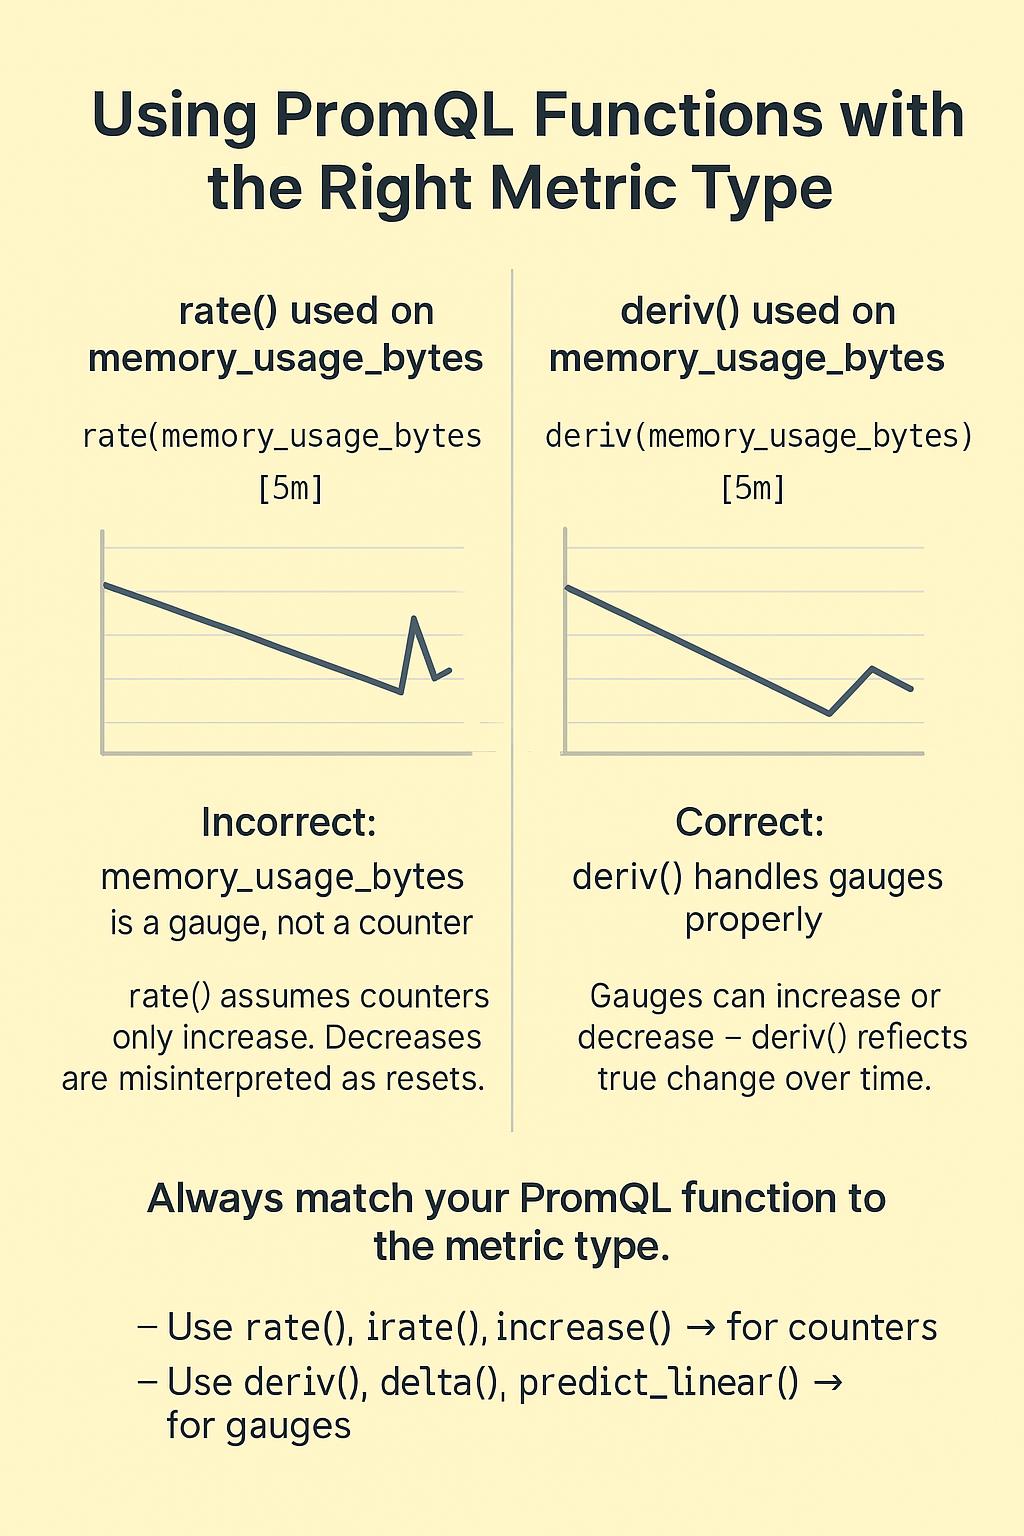
PromQL has a variety of functions — like rate(), irate(), increase(), deriv(), and predict_linear() — each designed for specific kinds of metrics. The issue comes when you apply one of these functions to the wrong type of metric.
For example, rate() is built for counters — metrics that only increase over time (like total requests). It assumes any drop in value is a counter reset, and it compensates for that. So if you use rate() on a gauge (which can go up and down naturally), it will misinterpret a normal decrease as a reset, and the result will be wrong.
Let’s say you apply rate() to memory usage:
rate(memory_usage_bytes[5m])
If memory usage drops — which is totally normal — rate() will treat that drop as a reset and return an inflated or inaccurate result.
Similarly, deriv() and predict_linear() are meant for gauges. If you apply those to counters, they won't know how to handle resets and will return nonsense or misleading output.
Prometheus won’t stop you from doing this — it doesn’t know the intent of your metric. So you need to be careful and understand what kind of data you're working with.
Quick guideline:
- Use rate(), irate(), and increase() with counters
- Use deriv(), delta(), and predict_linear() with gauges
Always make sure you understand the metric you're querying — whether it’s a counter or a gauge — before choosing a function.
Conclusion
Prometheus is a powerful tool — but only if you use it wisely. The mistakes covered here are incredibly common, even among experienced teams. By avoiding them, you can build more reliable monitoring systems, write more meaningful alerts, and scale Prometheus confidently.
Let’s recap:
- Avoid high-cardinality labels like user_id
- Preserve important labels during aggregations
- Scope your queries to the right jobs or services
- Always use for durations to reduce alert noise
- Choose appropriate rate windows based on your scrape interval
- Use PromQL functions that match your metric type
Getting these fundamentals right helps your monitoring stay efficient, accurate, and maintainable — especially at scale.
At Kubenine, we help teams set up infrastructure, cloud environments, and production-grade monitoring so that you can focus on building your product — not managing systems and alerts.
Recent Posts